Bitcoin registered a 25% rebound from annual low of $57,800 reached on July 1, 2026. Spot price trades around $83,000-$84,000, representing a 9.62% year-to-date loss relative to opening price of $87,508 on January 1.
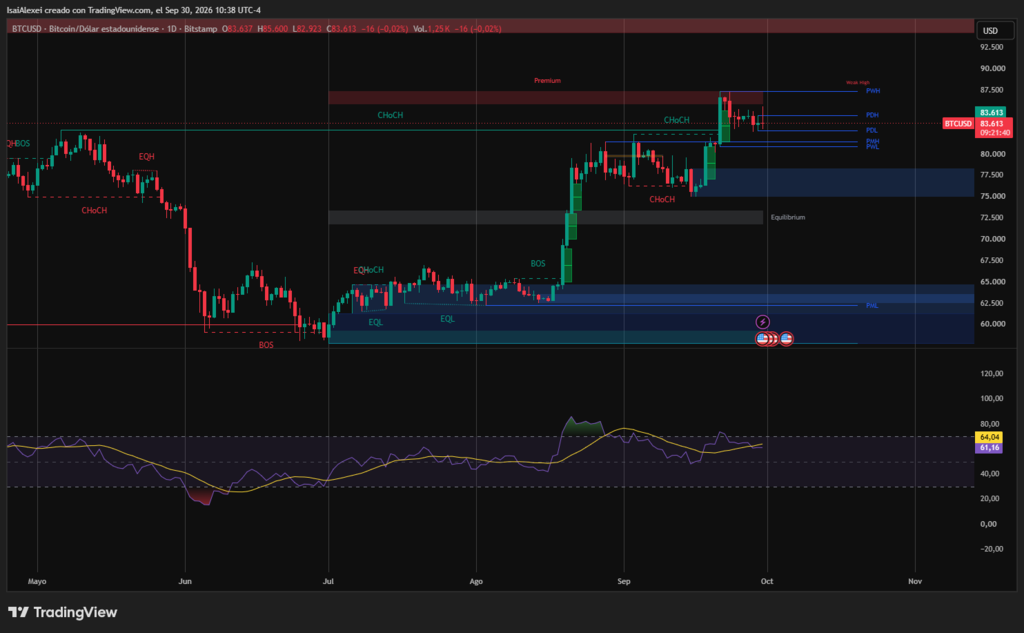
The contradiction between short-term rally and negative annual return is not anecdotal. It exposes a market structure where institutional flows, derivatives, and halving cycle operate in divergent directions.
The Rebound: Mechanics of a Short Squeeze
The upward move from $59,000 to $87,400 over eight months had as initial catalyst a short squeeze of significant scale. When price exceeded $85,000 on September 21, more than $648 million in short positions were liquidated in one session.
Mechanism is self-reinforcing: price increase activates stop-loss orders on leveraged bearish positions, generating forced buy orders which push price higher.
Open interest on Binance fell from $10.6 billion to $9.2 billion in week after breakout, a contraction of $1.4 billion indicating exhaustion of squeeze fuel.
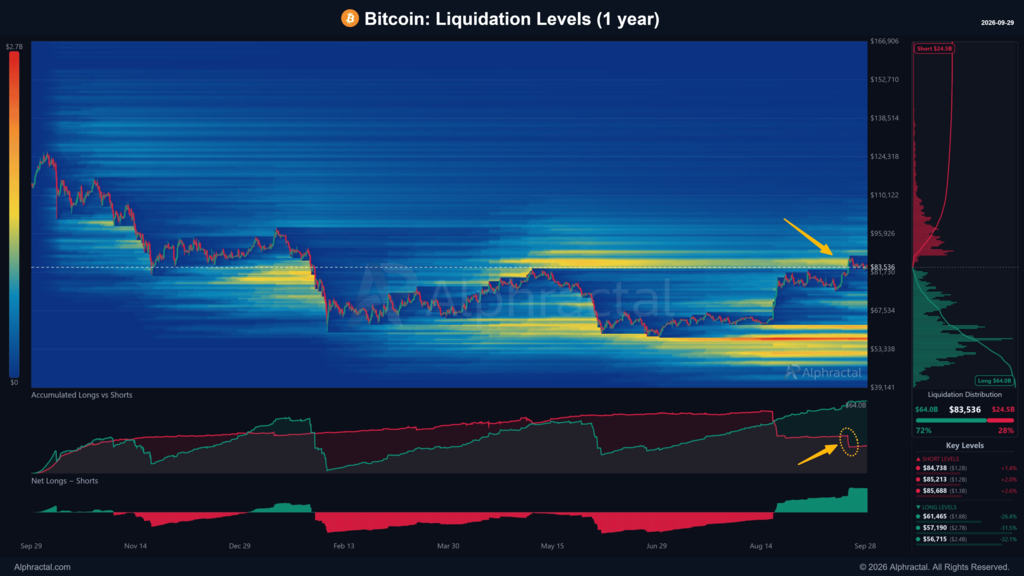
According to Alphractal, rally “was enough to eliminate main short positions built during last 365 days.” Leveraged position structure has inverted: liquidation clusters now concentrate on long side, introducing symmetric risk of forced sell cascade if momentum fades.
Institutional Flows: Recovery via ETF
Spot Bitcoin ETFs in United States recorded net inflows of $2.39 billion during week of September 21-25, 2026, highest weekly figure of year. Monday September 21 concentrated $999 million of total, coinciding with daily rally of 6.7%. BlackRock (IBIT) absorbed approximately $1.2 billion, followed by Fidelity (FBTC) with $701.7 million and ARK 21Shares (ARKB) with $294.7 million.
Relevant data is not absolute volume but effect on annual cumulative. ETFs had registered net outflows of $5.53 billion between May and July, with eight consecutive weeks of redemptions culminating on July 2. September reversal brought net annual flow to positive territory, approximately $925 million.
Recovery in institutional channel coincides with on-chain data: $2.52 billion in BTC were withdrawn from exchanges between September 22 and 24, and wallets with balances of 100 to 1,000 BTC accumulated 113,950 BTC since mid-July.
The how of institutional flow is linked to United States fiscal policy. Bloomberg ETF analyst Eric Balchunas related large inflows to Treasury plans to expand long-term bond buybacks. Debasement trade narrative—search for hedge against monetary debasement—has channeled capital into BTC from sectors traditionally allocated to gold or fixed income.
| Period | Net Flow | Key Detail |
|---|---|---|
| May-July 2026 | -$5.53B | Eight consecutive weeks of redemptions, culminating July 2 |
| Week Sept 21-25, 2026 | +$2.39B | Highest weekly figure of year |
| Monday Sept 21, 2026 | +$999M | Coincided with daily rally of 6.7% |
| BlackRock IBIT | +$1.2B | Largest single issuer inflow |
| Fidelity FBTC | +$701.7M | Second largest |
| ARK 21Shares ARKB | +$294.7M | Third largest |
| Cumulative annual | ~+$925M | Reversal to positive territory |
Warning Signals: Relative Performance and Cycle
Despite 25% rebound, Bitcoin YTD return is approximately +7.6%, below commodities (+47.3%), United States equities (+16-20%), and convertible bonds (+15.2%). Five-year comparison is less favorable: between end-2020 and August 2026, Bitcoin fell 30%, while Google gained 291%, BAE Systems gained 238%, and gold gained 151%.
| Asset | 2026 YTD Return | 2020-Aug 2026 Return |
|---|---|---|
| Bitcoin | +7.6% | -30% |
| Commodities | +47.3% | — |
| US equities | +16-20% | — |
| — | +291% | |
| Gold | — | +151% |
| BAE Systems | — | +238% |
Second structural factor is halving cycle. 2026 is third year of cycle following April 2024 halving. Historically, third year has coincided with bear markets: after 2016 halving, bear market extended to December 2018; after 2020 halving, bear market began November 2022 and took BTC to $15,443.
Current cycle peak was reached in January 2026 near $100,000, and subsequent decline to $57,800 represents 54% drawdown from peak, consistent with magnitude of previous cyclical corrections.

| Cycle | Halving | Peak | Bear Low | Drawdown |
|---|---|---|---|---|
| 2016 | July 2016 | Dec 2017 ~$19.7K | Dec 2018 ~$3.1K | -84% |
| 2020 | May 2020 | Nov 2021 ~$69K | Nov 2022 $15.4K | -77% |
| 2024 | Apr 2024 | Jan 2026 ~$100K | Jul 2026 $57.8K | -54% |
Interpretation of cyclical structure divides analysts. Base case from several investment banks projects $100,000 for end-2026, with extension toward $150,000 in 2027.
Benjamin Cowen warns weekly close of BTC will activate a technical trigger determining direction until year-end, and suggests robust performance could shift toward early 2027.
I think the weekly Bitcoin close will lay the groundwork for what Q4 will look like.
If Bitcoin accepts above the May high, that will improve the bull case substantially.
Acceptance back below would just look like a massive fakeout before typical Q4 weakness (but not… pic.twitter.com/xMSMjCUpQ1
— Benjamin Cowen (@benjamincowen) September 25, 2026
Recovery Without Structural Confirmation
The 25% rebound indicates selling pressure has diminished and institutional interest has reactivated via ETF. However, three conditions require fulfillment for recovery to acquire structural character: first, ETF inflows remain without dependence on punctual macroeconomic catalysts; second, price exceeds annual opening level of $87,508, currently 4-5% from spot; third, third-year halving seasonality does not impose a new downside test before cycle enters recovery phase.