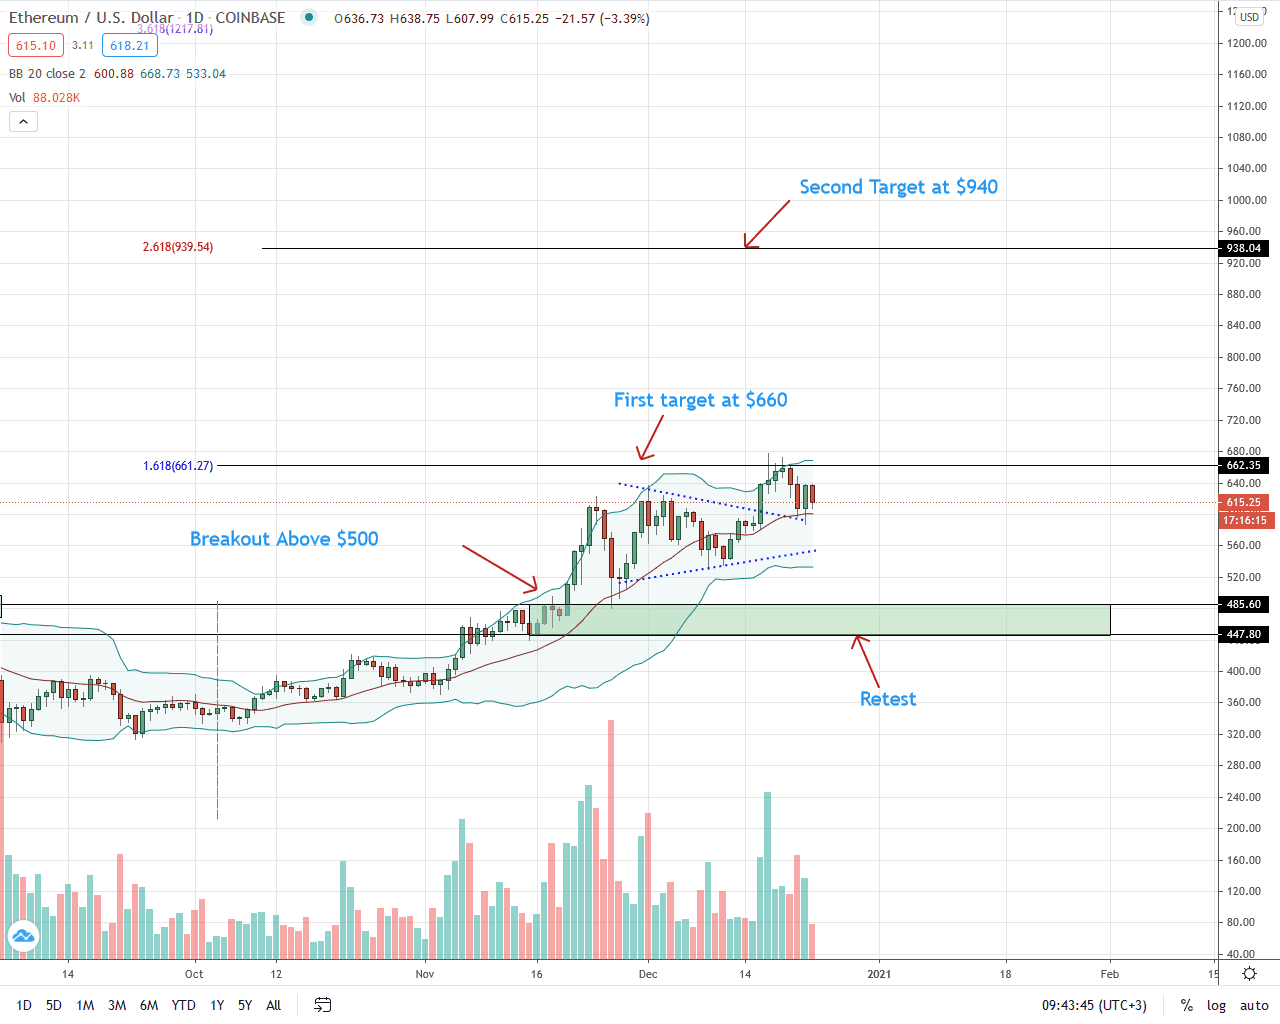
The Ethereum price, on Dec 22, reversed losses and printed higher as gleaned from the daily chart. Gains could be pinned to the changing fundamental dynamics and on-chain developments.
Vitalik Calls XRP a Shit Coin
Late Dec 21, it was revealed that the United States Securities and Exchange Commission (SEC) would sue Ripple and its CEO, Brad Garlinghouse.
Following this, Brad said it wasn’t good that the SEC was keen on stifling innovation in the US, choosing to protect projects such as Bitcoin and Ethereum whom he said was under the grip of China.
In response, Vitalik responded by saying XRP was a shit coin. The outflow of capital from projects XRP could help steady the Bitcoin and Ethereum prices that at the time of writing were reversing from key support levels.
Cumulative Stablecoin Volumes to Rise above $1 Trillion
Meanwhile, the total on-chain stablecoin volume will surpass the $1 trillion mark before the end of 2020, marking a successful year.
Over the years, Ethereum has surpassed Bitcoin to be the most active network not only from developer count but to the number of transactions posted.
Spurred by the rise of DeFi in 2020, USDT is cementing its position as a choice stablecoin, followed by USDC, and others. USDT has a market cap of above $20 billion.
They play a vital role in being a shield in times of market turbulence and conduits to DeFi where protocols like Curve facilitate the trustless swapping of various stablecoins and fiat synthetics.
Coupled with ongoing improvements, most analysts now project the ETH price to not only rally to $1k but to blast past $10k in 2021.
Ethereum Price Analysis
The Ethereum price is now up five percent in the last week of trading, trading at $615 after sinking to $587 on Dec 22.
Technically, the path of least resistance is upwards. Specifically, the ETH/USD is trading within a bullish breakout pattern.
From the daily chart, buyers are in control after breaking above the bull flag on Dec 16. It was confirmed on Dec 17 and 18 but soon corrected on Dec 20 and 21.
Following the retest of the support—previous resistance trend line on Dec 22, every low is a buying opportunity in the immediate term.
Considering how bullish the trading community is, the first target will be at $680—Dec 2020 high, and later $940, the 2.168 Fibonacci extension level of July to August 2020 trade range.
Since prices are also ranging inside the Dec 16 bull bar—supporting buyers from a volume analysis point of view, possible stop losses can be placed at the $550 to $570 zone.
Chart Courtesy of Trading View
Disclosure: Opinions Expressed Are Not Investment Advice. Do Your Research.
If you found this article interesting, here you can find more Ethereum News


