TL;DR
- The Bitcoin Rainbow Chart places the current price (~$75,900) near the lower edge of the “Accumulate” band.
- Lower bands (“BUY!” and “Basically a Fire Sale”) extend from ~$54,700 down toward the $40,000s.
- The model suggests a long-term fair value between $120,000 and $160,000 by late February.
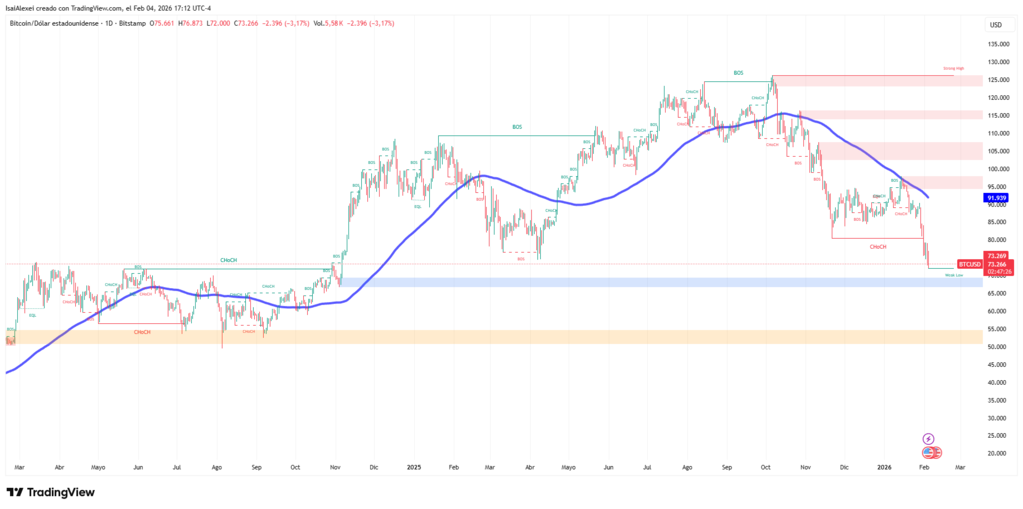
The Bitcoin Rainbow Chart, a long-running valuation model based on a logarithmic growth curve, places BTC price behavior within a wide but structured range as February 28, 2026 approaches. The model does not predict timing. Instead, it frames price zones where Bitcoin has historically traded relative to long-term adoption. Current readings place Bitcoin near $75,900, following a pullback from levels above $80,000 earlier in the month.
At current prices, Bitcoin sits close to the lower edge of the “Accumulate” band, which spans roughly $73,700 to $95,100. Historically, ranges inside this zone appear during recovery phases after corrections. Downside risk tends to compress while long-term value remains intact.

Lower bands remain visible. The “BUY!” zone begins near $54,700, while the “Basically a Fire Sale” area extends down toward the low $40,000 range, levels linked to panic selling and forced exits in prior cycles.
Price pressure meets long-term valuation signals
Recent market action adds context to the chart. Bitcoin lost its 100-week moving average near $85,000, signaling firm seller control. Traders now monitor $75,000 as a near-term reference point, with deeper tests toward the 200-week average near $58,000 if stress persists. Outside crypto, broader risk assets show strain.
A sharp drop in large technology stocks, paired with reversals in gold and silver, reflects profit taking after early-year gains. Crypto markets absorbed more than $1.6 billion in long liquidations, reinforcing short-term pressure.
Despite volatility, the Rainbow Chart keeps attention on structure rather than headlines. If Bitcoin tracks its historical growth path instead of speculative extremes, projected fair value by late February clusters between $120,000 and $160,000, spanning the upper “Still cheap” band and lower “HODL!” zone. Higher bands stretch toward far loftier levels, yet history links such areas to excess rather than stability.
The model does not replace macro or on-chain analysis. Still, at current levels, the Rainbow framework presents Bitcoin as undervalued on a long horizon, while short-term price action remains shaped by liquidity shifts and broader market correction.