
TL;DR
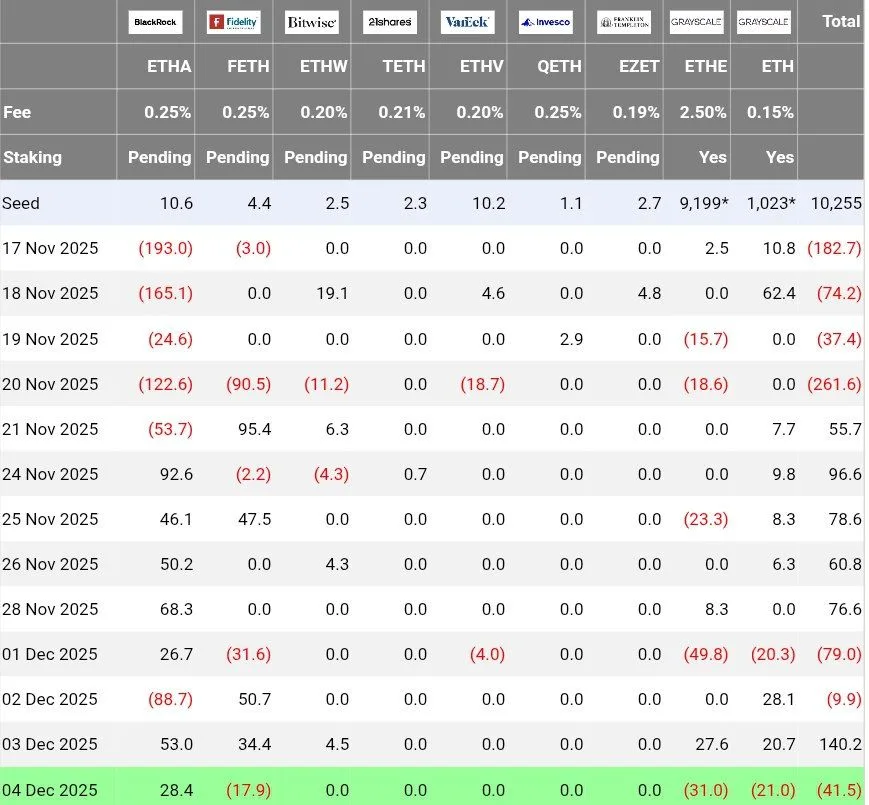
- Ethereum is testing key resistance levels while its U.S. spot ETFs register a net outflow of $41.5M, despite BlackRock adding $28.4M to ETHA.
- Higher-fee ETFs, such as Fidelity’s FETH, VanEck’s ETHV, and Grayscale’s ETHE and EZET, experienced significant outflows, while Bitwise and 21Shares maintained flows near zero.
- The $4,800 zone marks the first critical resistance; surpassing it could open the path to $6,800 and $8,800.
Ethereum is facing important resistance levels just as its U.S. spot ETFs report a net outflow of approximately $41.5 million, despite BlackRock contributing $28.4 million to its ETHA fund.
The flows reflect broad selling across several issuers. Products like FETH, ETHV, ETHE, and EZET registered substantial withdrawals. Higher-fee ETFs faced more pronounced outflows, while Bitwise and 21Shares maintained near-zero flows. The mix of inflows and outflows indicates that institutional demand remains present but uneven, suggesting more of a rotation among products than a broad shift in sentiment toward Ethereum.
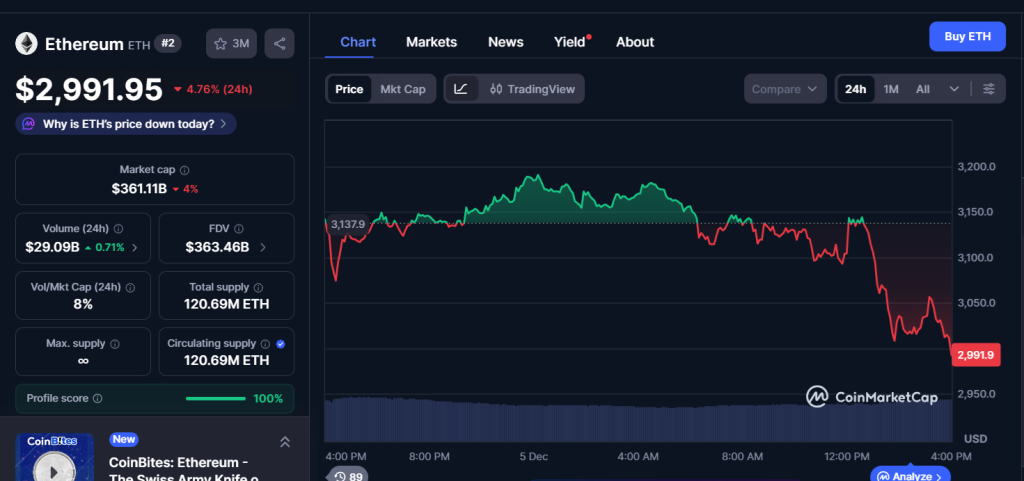
From a technical perspective, analysts are focusing on the $4,800 area as the first critical resistance. According to Ali Martinez, breaking this level could open the way to $6,800 and $8,800, based on historical price structure since 2021 and horizontal resistance bands. Currently, Ethereum trades near $3,000, below the mid-range band at $3,600, within a wide range spanning support at $1,200 up to resistance at $4,800. The next reaction in these zones will determine whether the recent bullish move consolidates or selling pressure returns.
Ethereum Fell to $3,000 and Tests Support and Resistance
Ethereum rebounded from a high-volume support near $2,480, recovering part of the mid-range band that previously acted as both support and resistance. The bounce temporarily broke the downtrend line that guided the last selling phase, generating a slight shift in momentum toward the upside.
However, the overall structure still reflects a series of lower highs formed since September. Accumulated supply areas between $3,400 and $3,900 represent the next obstacle that the price must overcome to confirm a sustained reversal.
The market is closely watching whether Ethereum can maintain this recovery and push toward the $4,800 horizontal resistance