
TL;DR:
Chart Patterns and Technical Signals Underpin Bullish Outlook
The Dragonfly Doji form at a long‑standing trendline support suggests buyers are re‑entering. This kind of candlestick — where price opens, falls sharply, but then recovers to finish near its opening point — is traditionally interpreted as a sign of market indecision resolving in favor of bulls. In Dogecoin’s case, the Doji showed up right at a level that has previously acted as a reliable springboard for large rallies. This historical context gives this reversal much more weight.
Recent price behavior reinforces the bullish setup. After surging past $0.145, Dogecoin settled into a narrow range between $0.145 and $0.149. That consolidation phase, rather than a clear downtrend, suggests the recent slump may have been a “cooling‑off” — not collapse. On the shorter time frame, the price appears to be forming a base between $0.1450 and $0.1500, the area that must hold for buyers to build momentum. Meanwhile, resistance clusters emerge around $0.1600 and $0.1700, which DOGE must clear to confirm a move upward.
Broader technical indicators point to fading bearish pressure. On the daily chart, the relative strength indicator (RSI) sits near 44 — a neutral reading signaling that the asset is neither oversold nor overbought. The MACD remains shy of a bullish crossover, but both its lines are flattening, hinting at waning bearish momentum. If this stabilization holds, it could pave the way for renewed upward movement.
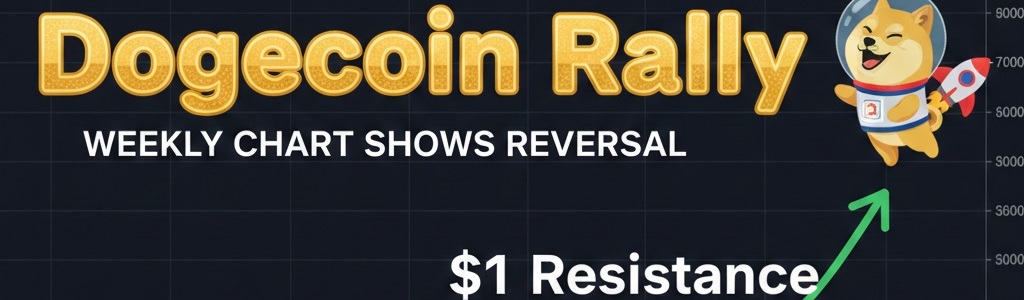
If the bullish signal holds, potential upside is significant. Based on historical precedents after similar chart setups, some analysts now view a run toward $1 as plausible. That would imply a gain of more than 600% from current levels — a considerable rally, though one that would likely require sequential breaks above resistance zones and sustained buying pressure.
Ultimately, while the charts offer promise, the path to $1 is not simple. Dogecoin must first prove that its base is stable and break decisively above the immediate resistance zones. But for now, the technical groundwork — from a Dragonfly Doji to stabilizing momentum indicators — suggests a potentially bullish turn.