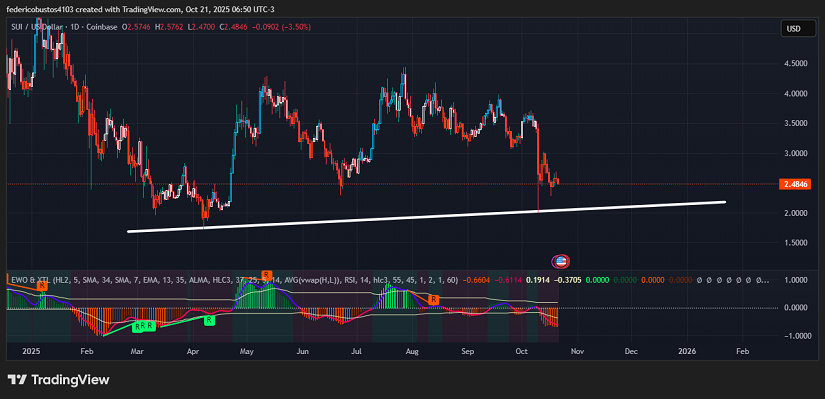
- Despite its initial rally, $SUI has entered a sharp correction from $4.44 down to $2.00, currently trading at $2.48 (-3.50%) in the last 24 hours.
- On the daily chart, a clear downtrend is visible, with the long-term ascending trendline (TL) around $2 acting as a key support, now at risk of breaking.
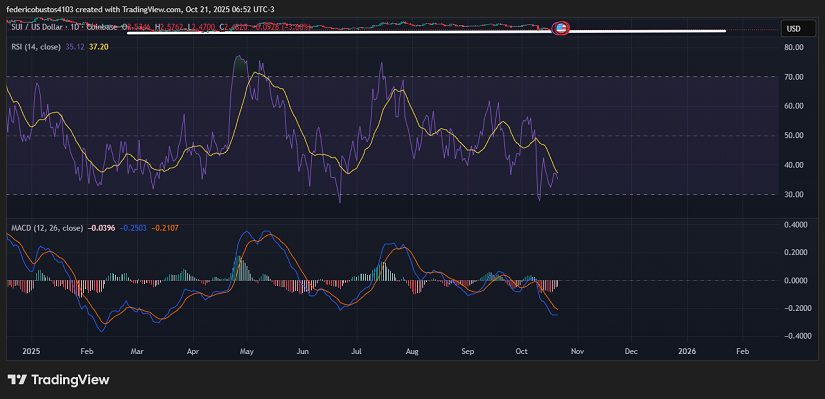
- Technical indicators show signs of weakness (low RSI, negative EWO, bearish MACD histogram), while volume has not yet supported a clear reversal, increasing the likelihood of a deeper correction toward support.
Between Innovation and Institutional Caution: The Two Faces of the SUI Ecosystem
On the fundamental side, SUI presents both progress and risks that shape its demand. On the positive front, its Layer-1 ecosystem is gaining notable cooperation: it was chosen as a launch partner for Google’s Agentic Payments Protocol (AP2). Such partnerships suggest greater institutional visibility and potential adoption for SUI.
However, the global context remains challenging. The broader crypto market is in a bearish phase, with investors favoring more established platforms. A recent article described SUI as “an L1 experiment” in an already saturated market, a perception that reduces institutional risk appetite in the short term.
In conclusion, while SUI’s technology and ecosystem are promising, which supports its long-term structural demand, the lack of immediate institutional enthusiasm and the cautious macroeconomic environment could slow down new capital inflows in the near term.
Technical Analysis of $SUI
From a technical standpoint, $SUI is undergoing a strong corrective phase, falling from $4.44 toward the $2 region, which aligns with its long-term ascending trendline. This zone currently serves as a key structural support, where price action is deciding whether to consolidate or continue falling.
Trading volume remains low, showing no signs of an accompanying rebound that would confirm a bullish reversal. In a downtrend, this lack of buying participation reinforces market weakness and increases the probability of an extension toward the $2 support zone. The EWO (Elliott Wave Oscillator) remains negative, signaling persistent bearish momentum and suggesting that the previous bullish impulse has faded, possibly leading to a broader corrective leg rather than a minor pullback.
Meanwhile, the RSI (14) sits around 35, approaching oversold territory, but without notable bullish divergences to indicate a trend reversal. While a short-term technical rebound may occur, there are still no firm reversal signals.
The MACD (12,26) histogram remains negative, and its signal line hasn’t crossed upward, confirming that bearish momentum prevails. Under these conditions, an aggressive long entry remains high-risk until a more favorable setup emerges.
Conclusion and Scenarios
The $SUI price faces a decisive technical juncture. Unless there is a volume uptick, a positive EWO divergence, and a bullish MACD crossover, the most likely outcome is a test of the $2 support, with a potential breakdown if selling pressure intensifies. Conversely, if $2 holds and accumulation signals appear, SUI could enter a consolidation phase that precedes a possible reversal in the medium term.
Technical charts courtesy of TradingView.
Disclaimer: The opinions expressed do not constitute investment advice. If you are looking to make a purchase or investment, we recommend that you always do your research.
If you found this article interesting, here you can find more ALTCOINS News.