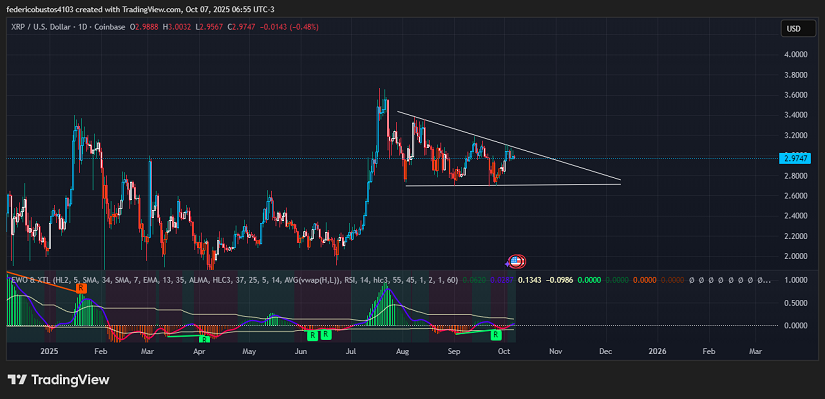
- XRP has been trapped in a descending triangle since July, with strong support around $2.70 and a narrowing downward dynamic resistance.
- On the fundamental side, the resolution of Ripple’s conflict with the SEC and recent news about banking license applications have boosted institutional confidence and could ignite renewed demand.
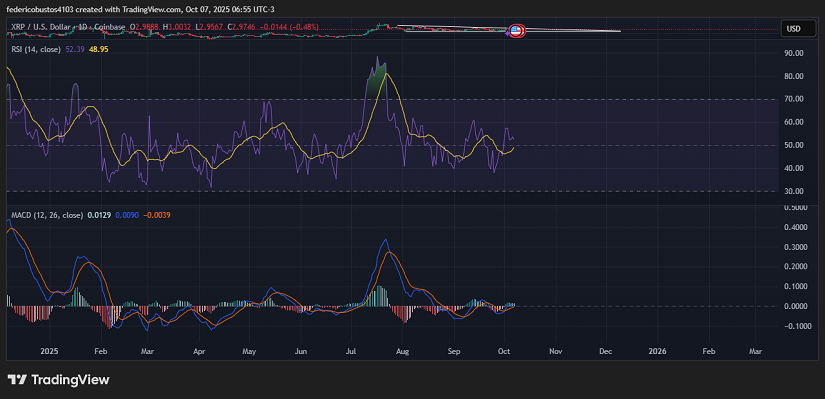
- Technically, indicators such as a neutral RSI, bullish MACD crossover, and EWO showing mild accumulation signs suggest the market is waiting for a clear directional breakout.
Between Regulation, Accumulation, and ETF Expectations
Over the past two weeks, several developments have strengthened XRP’s institutional case. Ripple has emphasized the role of the XRPL as a platform that combines regulated privacy with compliance, potentially attracting adoption from financial entities seeking to operate under secure legal frameworks. At the same time, regulatory optimism is growing around the potential approval of XRP ETFs between October 18 and 25, which could unlock institutional capital that has remained sidelined due to legal uncertainty.
On-chain data also shows that whales have accumulated over 120 million XRP, while social sentiment has turned bearish — a combination that has historically preceded bullish reversals in crypto markets. The mix of silent accumulation and retail fear may indicate repositioning before a potential surge.
There are also rumors that corporations may add XRP to their treasuries (large-scale purchase plans), which would further reduce circulating liquidity.
Technical Analysis of $XRP
From a technical standpoint, XRP is in a decisive phase within a well-defined descending triangle on the daily timeframe. Since reaching its local high near $3.66, the price has gradually declined, finding solid support around $2.70, a level tested multiple times without a decisive breakdown. This zone has become a structural floor, while the descending resistance line continues to act as a natural ceiling.
Volume has been steadily contracting, reflecting the classic calm before a major directional move. This drop in activity indicates that the market is building up energy, and a sudden expansion in volume will be key to confirming a breakout. The EWO shows a moderate bullish divergence, signaling that bearish momentum is internally weakening despite price stagnation, reinforcing the accumulation phase hypothesis.
The RSI, currently around 52, remains in the neutral zone but with a slight upward slope. This setup indicates that buyers are gradually regaining control, although stronger momentum is still needed to confirm a trend. A sustained RSI breakout above 60 would clearly validate a bullish scenario.
Meanwhile, the MACD began October with a bullish crossover, and the histogram has turned fully positive. If this recent crossover holds, it would signal a strong shift in momentum toward the upside.
Conclusion and Scenarios
If XRP breaks above the triangle’s upper trendline with increasing volume, it could trigger a move toward $3.50, possibly retesting the previous high at $3.66. This scenario would confirm a momentum shift and mark the start of an expansion phase.
Conversely, a downward move toward $2.80 could open the door to a retest of the $2.70 support, potentially leading to a sharper correction from that point.
At this stage, the market remains in a clear zone of indecision. Patience and risk management are essential, traders should wait for a confirmed breakout before acting, avoiding premature moves in a market that has yet to define its direction.
Technical charts courtesy of TradingView.
Disclaimer: The opinions expressed do not constitute investment advice.If you are looking to make a purchase or investment, we recommend that you always do your research.
If you found this article interesting, here you can find more XRP News.