
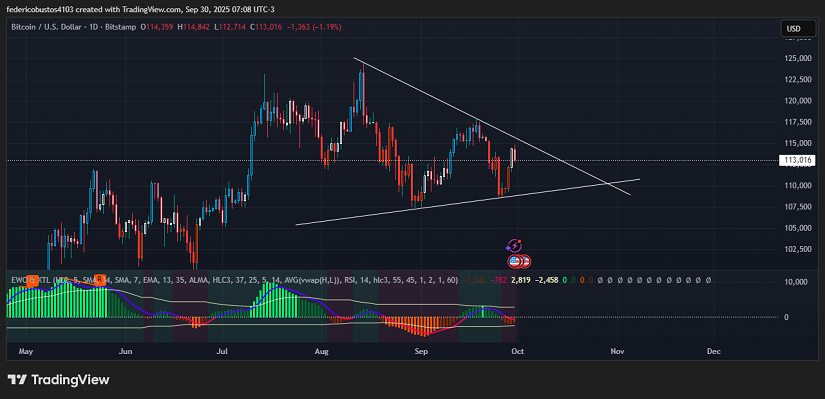
- After reaching its all-time high at $124,500, BTC has been trading within a symmetrical triangle without breaking key support.
- The current price of $113,016 (-1.19%) reflects a congestion area where the decision has yet to be defined.
- Recent fundamentals include strong ETF outflows, institutional rebalancing, and a new SEC regulation that could accelerate the launch of crypto funds.
What Is Driving or Holding Back Bitcoin Today?
Over the past week, the institutional market has shown clear signs of nervousness. Bitcoin spot ETFs recorded $903 million in net outflows, ending a four-week streak of positive inflows. Fidelity (FBTC) led withdrawals with nearly $300 million, while BlackRock (IBIT) attracted smaller flows ($174 million). At the same time, the combined outflows from BTC and ETH products exceeded $1.7 billion last week. Additionally, market participants believe that some of these exits were due to profit-taking and portfolio rebalancing ahead of the quarter close.
On the other hand, a relevant development came on September 18, when the SEC approved generic listing standards for commodity ETFs, including digital assets. This regulation reduces the approval burden for future launches, potentially accelerating the appearance of new ETFs beyond BTC and ETH. In fact, the SEC has requested the withdrawal of certain 19b-4 filings for altcoins such as SOL, XRP, and ADA to adjust them to the new regulatory framework. October is being viewed as a key month for regulatory decisions on 16 pending crypto ETFs.
Technical Analysis of $BTC
From a technical perspective, Bitcoin is at a point of maximum tension within a well-defined symmetrical triangle on the daily timeframe. After reaching its all-time high on August 14 at $124,500, the price began an orderly correction that, far from breaking structure, has precisely respected both the descending trendline and the ascending support. The area between $108,000 and $110,000 has acted as a structural base following the drop to $107,400, while dynamic resistance remains between $115,000 and $115,500, a key level that acts as a hinge between continued downside or an upside breakout.
The decreasing volume reflects a classic contraction phase before strong directional moves, increasing the probability of an imminent expansion. The EWO shows a marked bullish divergence, indicating that the market’s internal momentum is improving even while price remains range-bound.
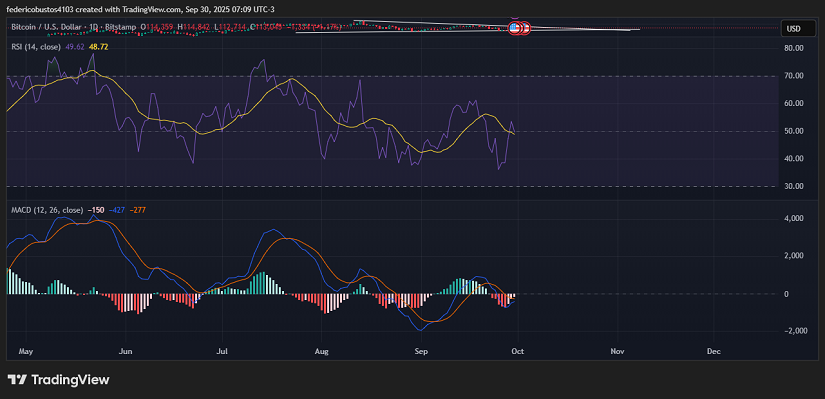
At the same time, the MACD is starting to curl toward the signal line and could generate a positive crossover in the upcoming sessions, a signal traditionally associated with the beginning of upward impulses. However, the RSI (49) still shows a negative slope and remains in neutral territory, reflecting that buyers have not yet taken full control of the market.
Conclusion and Scenarios
In simple terms, the technical structure is ripe for a breakout, but the market has not yet decided on direction. Any sustained close above $115,500 could trigger a rapid move toward the $120,000 to $122,000 zone, while a clear loss of $110,000 would reopen the path toward $107,400 as the first defensive level. The optimal stance in this scenario is not to anticipate, but to observe with precision and act only when price defines itself clearly.
Technical charts courtesy of TradingView.
Disclaimer: The opinions expressed do not constitute investment advice. If you are looking to make a purchase or investment, we recommend that you always do your research.
If you found this article interesting, here you can find more Bitcoin News.