
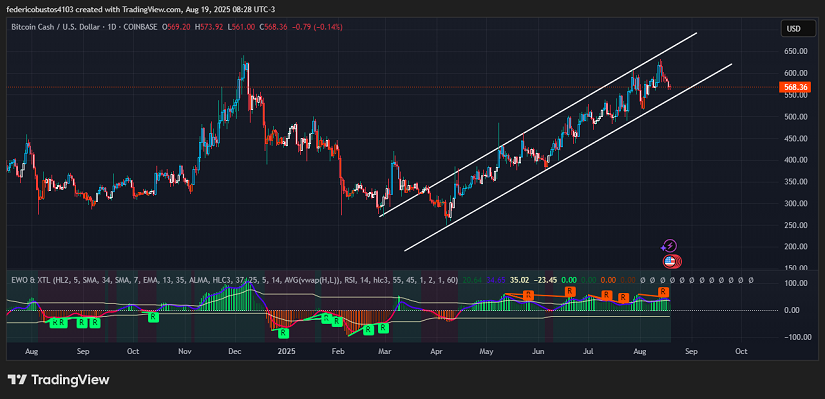
- Bitcoin Cash ($BCH) is trading at $568.36, brushing against the lower boundary of the bullish channel it has maintained since April, signaling an imminent risk of a breakdown.
- In recent weeks, significant whale accumulation has been observed, along with an annual high of $632.64, reflecting strong buying interest.
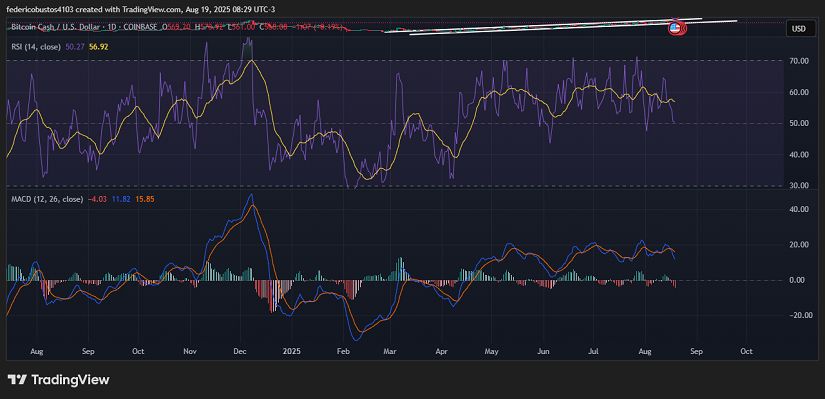
- However, technical indicators — declining volume, bearish EWO, RSI, and MACD — point to weakening momentum and a high probability of a correction toward $500.
Solid Fundamentals: Whale Accumulation and Retail Liquidity Amid an Uncertain Macro Backdrop
In recent weeks, Bitcoin Cash reached a yearly high of $632.64, fueled by a notable increase in open interest and a dominant buying phase in derivatives, highlighting strong demand for the asset. At the same time, substantial whale accumulation has been recorded: the largest net inflow of Bitcoin Cash since July, underscoring institutional support. Additionally, a growing wave of retail liquidity appears poised to further boost BCH, especially within the context of a new altcoin season supported by a more favorable regulatory climate.
Nonetheless, on the macro and regulatory fronts, caution persists. While the broader crypto industry is attracting institutional attention (such as ETFs, which are boosting the crypto environment), there are no specific regulatory advancements for BCH. The upcoming termination of USDT support on the Omni network (linked to BCH SLP), scheduled for September, could also reduce liquidity in that ecosystem. Therefore, while accumulation and investor interest remain solid pillars of support for the cryptocurrency, its short-term outlook will largely depend on how technical demand evolves within this still uncertain environment.
Technical Analysis of BCH
Since April 7, Bitcoin Cash has staged a spectacular rally of +152%, climbing from around $250 to $632 in the August 13 session, almost reaching the top of the bullish channel. Since then, the price has entered a correction and is currently at $568.36, very close to the channel’s dynamic support.
Volume was strong during the initial rally but has dropped significantly throughout the corrective phase, reflecting weakening buying conviction and early signs of technical exhaustion. The EWO (Elliott Wave Oscillator) confirms this loss of momentum: green bars have steadily diminished, signaling increasing selling pressure.
The RSI, currently in the neutral zone (around 50), shows a slight downward slope, suggesting fading bullish momentum with ample room to fall before reaching oversold conditions. Lastly, the MACD displays a bearish crossover: the fast line broke below the slow line, and the histogram has turned negative, reinforcing the narrative of sellers taking control of price action.
Conclusion and Scenarios
The technical structure suggests a high risk of a bearish breakdown from the channel. If this occurs, the price will likely seek liquidity and support around $500, a critical level to halt a deeper correction. To reverse this bearish outlook, a sustained rebound with rising volume would be required, enabling BCH to once again reclaim the $630–$640 zone.
Technical charts courtesy of TradingView.
Disclaimer: The opinions expressed do not constitute investment advice. If you are looking to make a purchase or investment, we recommend that you always do your research.
If you found this article interesting, here you can find more ALTCOINS News.