- ADA’s current price ($0.6218) is once again hovering near the critical support level of $0.6166 after a 28% drop from the $0.8643 peak recorded in May.
- Although there has been immediate whale dumping, ADA has remained in the top‑10 cryptocurrencies, with trading volume rising approximately 79% in the last 24 hours.
- Technically, it’s not far from breaking the downtrend; however, indicators such as EWO, RSI, and MACD suggest that further bullish momentum is unlikely.
Top 10 Consolidation, Whale Pressure, and Resilience Amid Global Tensions
Over the past two weeks, ADA has consolidated its position among the ten largest cryptocurrencies, reducing the risk of falling out of that ranking. Additionally, 24-hour trading volume increased by 79%, signaling higher market activity. Despite this, on-chain data shows that whales sold over 270 million ADA, creating downward pressure.
On a macro level, the international environment—with geopolitical tensions (Israel-Iran conflict)—has raised risk aversion, impacting appetite for altcoins like ADA.
At the same time, institutional resilience remains strong: adoption projects in Africa and the ongoing development of Hydra and Voltaire provide solid fundamentals, although actual network and DeFi usage demand has shown mixed signals recently. Nevertheless, the Cardano ecosystem maintains a constructive outlook, emphasizing scalability and governance, factors that could attract new demand if the macroeconomic environment stabilizes in the coming weeks.
Technical Analysis of ADA
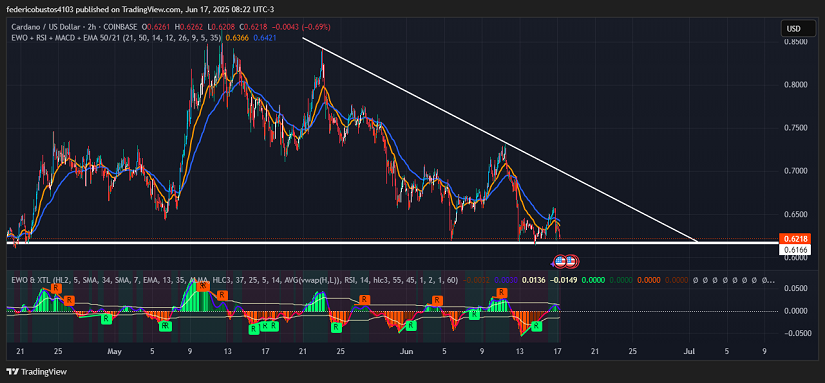
From a technical standpoint, on a 2H chart, $ADA is in a key zone. The price tested the $0.6166 support twice (on June 5 and 14) and then rebounded strongly (+5%). In recent hours, however, it pulled back again, currently sitting at $0.6218 (-1.99%).
The downtrend line drawn from a major high in May remains unchallenged. A breakout with volume would be needed to confirm a significant rally. The 21- and 50-period moving averages are diverging. For the downtrend to reverse, we would need to see the 21 EMA cross above the 50 EMA, triggering a short-term “golden cross” pattern. Below, we can see the EWO indicator registered positive histograms and green spikes, although it has recently declined again.
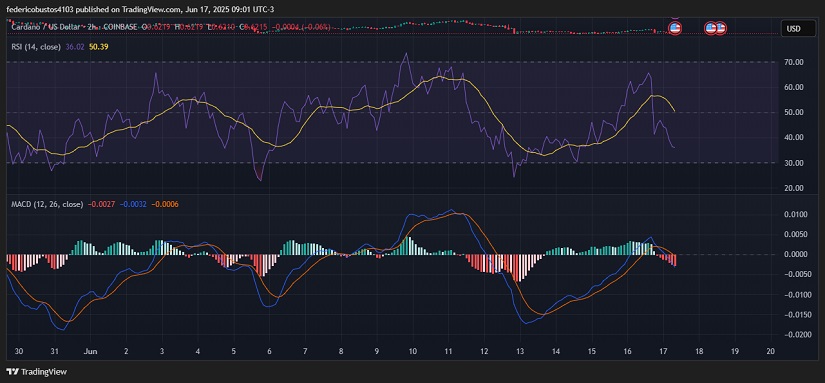
The RSI recovered from oversold territory (on June 13) up to around 65, but without reaching the overbought level (>70), it has since dropped back to 36.02. On the MACD, the blue (MACD) and orange (signal) lines crossed bullish a few sessions ago, but failed to sustain momentum and have now reverted to a bearish setup.
Conclusion and Scenarios
Technically, the structure still favors continuation of the bear market, which contradicts Cardano’s fundamental backdrop. If key closes and volumes are met, ADA could break its support and head toward more significant lows.
Technical charts courtesy of TradingView.
Disclaimer: The opinions expressed do not constitute investment advice. If you are looking to make a purchase or investment, we recommend that you always do your research.
If you found this article interesting, here you can find more CARDANO News.