- Ripple is pushing XRP and its stablecoin RLUSD as faster and cheaper alternatives to the SWIFT system, highlighting new partnerships in the UAE and the U.S. that strengthen their use case for global and institutional payments.
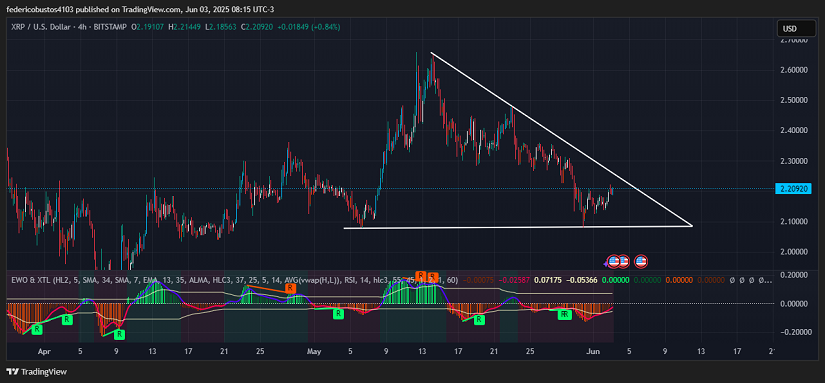
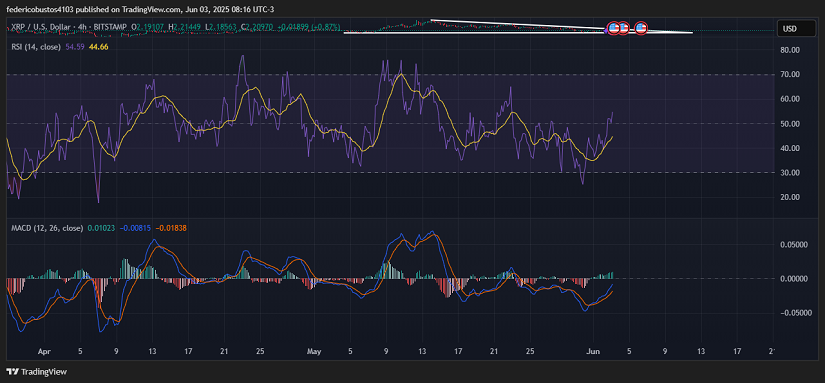
- XRP is forming a descending triangle with support at $2.08; indicators such as MACD, RSI, and EWO signal bearish exhaustion and a potential bullish rebound.
- If XRP breaks the downtrend, the immediate technical target is $2.48; but if it loses the $2.08 support, the rebound thesis is invalidated and the downtrend may continue.
XRP and RLUSD Challenge SWIFT
In the past month, Ripple has intensified its offensive against the SWIFT system, positioning XRP and its RLUSD stablecoin as modern, efficient alternatives for cross-border payments. According to Ripple, its blockchain-based solution cuts costs, speeds up transactions, and eliminates manual processes that still dominate traditional financial rails.
Ripple has also launched its “Ripple Payments” platform in the UAE through partnerships with Zand Bank and Mamo. This tool enables cross-border payments using crypto, stablecoins, and fiat currencies, strengthening XRP’s real-world utility. Additionally, Ripple has expanded its U.S. presence through “Hidden Road”, which now offers OTC crypto swaps, broadening institutional access.
Though the SEC has delayed its decision on an XRP ETF, Ripple maintains that fungible cryptocurrencies traded on secondary markets should not be classified as securities. This debate keeps regulatory attention on XRP, but it hasn’t slowed ecosystem expansion.
Meanwhile, economic uncertainty under the Trump administration could drive interest in assets like XRP, seen as tech-driven safe havens during times of fiscal and trade instability.
TECHNICAL ANALYSIS OF XRP
From a technical standpoint, the 4-hour chart shows a descending triangle pattern, with strong support at $2.08 and a downward trendline pushing price lower. This formation signals an approaching breakout point: either upward or further downward. However, technical indicators favor a potential rebound. XRP is currently priced at $2.20, with a slight 0.56% increase over the last 24 hours.
Volume has stayed moderate during the downtrend, suggesting a correction without mass capitulation or extreme selling pressure. The EWO shows clear bullish divergence: while the price moves sideways, the red histogram bars on the EWO have been shrinking, signaling weakening bearish momentum.
The RSI, now at 54, has risen strongly from oversold zones, though not in a straight line. Meanwhile, the MACD recently made a bullish crossover, and the histogram flipped back to green, confirming the start of a possible recovery phase.
CONCLUSION AND SCENARIOS
The weakening selling pressure, along with bullish technical signals, supports the rebound thesis. If price breaks the descending trendline, the next technical target is the $2.48 zone, where the first major resistance lies. Meanwhile, the key support remains $2.08; losing this level could invalidate the bullish scenario.
Technical charts courtesy of TradingView.
Disclaimer: The opinions expressed do not constitute investment advice.If you are looking to make a purchase or investment, we recommend that you always do your research.
If you found this article interesting, here you can find more XRP News.