
- The cooling of the U.S. economy is boosting expectations that the Federal Reserve will lower interest rates, which benefits risk assets like bitcoin.
- Bitcoin ETFs have attracted over $4 billion in just ten days, reflecting renewed institutional appetite for cryptocurrencies.
- Decreasing volume, bearish RSI divergence, and a loss of momentum in the MACD and EWO suggest that bitcoin could undergo a short-term correction, with key support levels between $88,000 and $90,000.
The Market Watches the FED and Institutional Investors
The market is closely watching the upcoming Federal Reserve meeting on May 7, as signs of an economic slowdown in the U.S. increase bets on a rate cut. This expectation has been a major driver behind bitcoin’s recent rally, since a lower-rate environment typically favors risk assets. Furthermore, in a context of international trade tensions and global volatility, Bitcoin is once again positioning itself as a “safe haven” asset or strategic hedge against uncertainty.
At the same time, the strong inflow of institutional money stands out: bitcoin ETFs added more than $4 billion in just ten days, showing that major market players are seeking crypto exposure.
Let’s not forget that after hitting all-time highs of $109,500 in January, bitcoin has struggled to consolidate above the key psychological barrier of $100,000, keeping investors on edge as they await the next economic and political signals.
Technical Analysis of $BTC
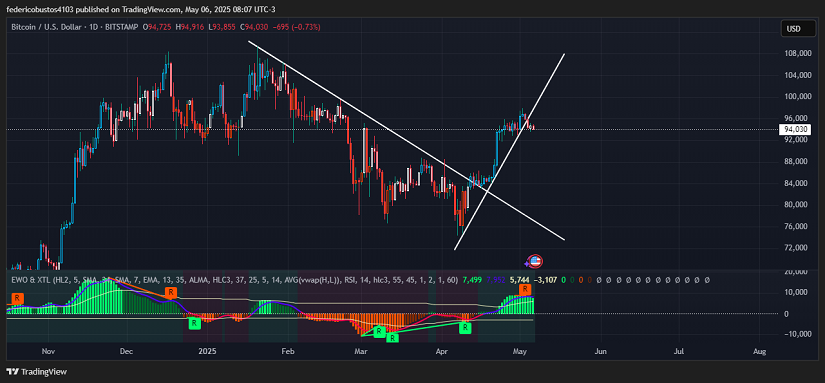
From a technical standpoint (daily compression), the break of the upward trendline that started in early April is a significant development. Bitcoin surpassed $97,000 last Friday but pulled back over the weekend and is now hovering around $94,030, showing a mild 0.73% decline over the past 24 hours.
Volume has decreased on recent daily candles, indicating a lack of conviction from buyers and raising the probability of a correction. The EWO (Elliot Wave Oscillator) remains in positive territory but is beginning to show a loss of momentum and is entering the escape band, suggesting the rally may be running out of steam.
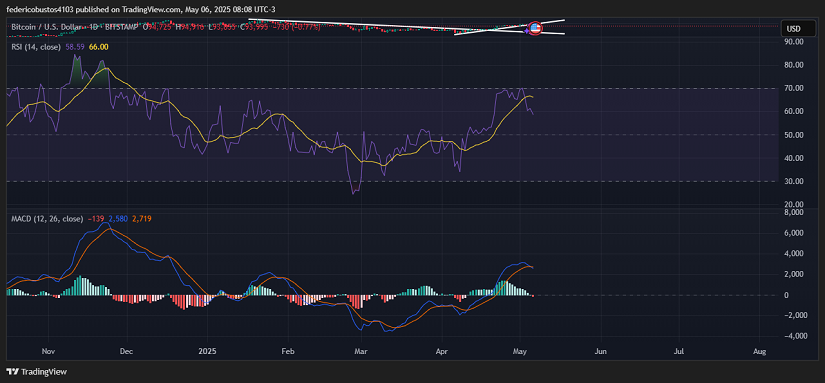
The RSI, sitting at 59, shows a clear bearish divergence: while price was making new highs, the RSI began tracing lower highs, signaling weakness in the trend.
Meanwhile, the MACD remains in positive territory, but the crossing of the fast and slow averages and the histogram’s drift into the red reflect a loss of bullish momentum.
Conclusion and Scenarios
All of this points to a likely short-term correction, with key support levels between $88,000 and $90,000. If the price holds this zone, it could consolidate for another bullish attempt; if it breaks below, we may see deeper declines.
Technical charts courtesy of TradingView.
Disclaimer: The opinions expressed do not constitute investment advice. If you are looking to make a purchase or investment, we recommend that you always do your research.
If you found this article interesting, here you can find more Bitcoin News.