
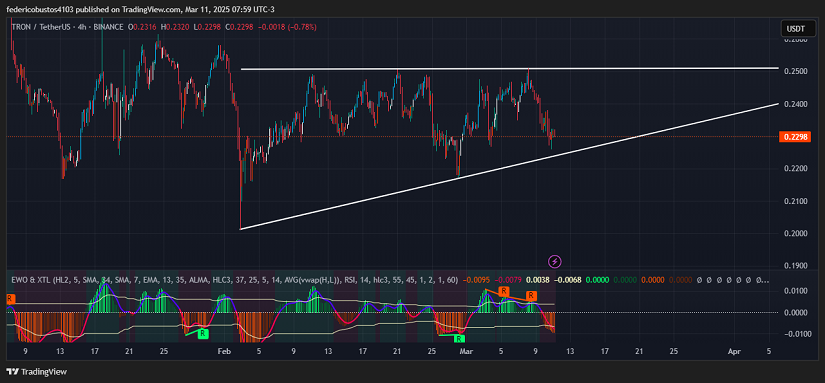
- TRON has shown a loss of momentum in recent sessions, consistently facing rejection around the $0.2510 resistance level.
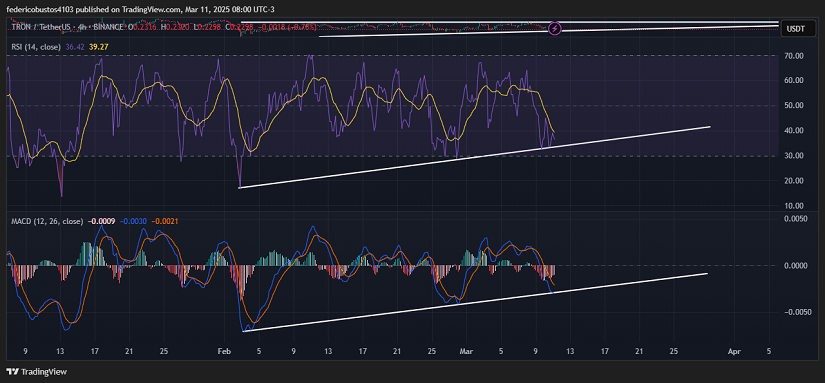
- Technical indicators such as the RSI and MACD reflect signs of bullish exhaustion, with a bearish inclination that could trigger further corrections.
- The declining trading volume and lack of new catalysts reinforce a potential bearish scenario, with targets in the $0.21-$0.19 range.
$TRX Enters a Weak Phase as Market Uncertainty Grows
In recent days, the cryptocurrency market has been influenced by significant events affecting its dynamics. U.S. President Donald Trump signed an executive order to establish a “strategic reserve” of Bitcoin, using approximately 198,000 BTC confiscated by the Department of Justice. Rather than boosting the value of cryptocurrencies, this announcement led to price declines, sparking debates about centralization and government control in the crypto space.
Against this backdrop, $TRX, the native token of the TRON network, has exhibited a similar performance to major cryptocurrencies like BTC, ETH, and BNB. Currently, it is trading around $0.2298, reflecting a 1.91% decline in the last 24 hours and a weekly drop of 3.27%. The 24-hour trading volume stands at $930.90 million, while its market capitalization is approximately $21.84 billion.
TRX Technical Analysis
In the 4-hour chart, $TRX appears to be breaking downward from a triangular pattern, suggesting a continuation of the downtrend that started in mid-February. Technical indicators support this bearish scenario, with declining trading volume signaling exhaustion of previous bullish moves. The Elliott Wave Oscillator (EWO) shows a convergence, meaning new lows are forming in both price and the indicator itself, confirming that bearish pressure still dominates the market. Additionally, multiple rejections have been observed at a strong resistance level around $0.2510.
The 14-period RSI, currently at 36.42 and trending downward, is approaching the oversold zone (below 30), which could attract buyers if the price decline continues. However, its current position suggests there is still room for further correction.
Meanwhile, the MACD (12,26) has formed a bearish crossover, which started on March 8, signaling a decline in bullish momentum. This crossover indicates that the downtrend may continue, as the widening gap between the MACD lines suggests increasing selling pressure.
Conclusion and Possible Scenarios
The short-term bearish trend remains dominant for $TRX, supported by technical indicators that point to an extended bear market scenario. If a confirmed breakdown of the triangle occurs, the next target could be in the $0.21-$0.19 range, at best.
Technical charts courtesy of TradingView.
Disclaimer: The opinions expressed do not constitute investment advice.If you are looking to make a purchase or investment, we recommend that you always do your research.
If you found this article interesting, here you can find more TRON News.