
Tron (TRX) price has steadily declined from $0.01450 to the current $0.01172 representing a 19 per cent decline over a period of seven days spanning from the 21st November to the 27th of November 2018.
The cryptocurrency registered the weeks high on 21st November at around 10 am by hitting $0.01525 before embarking on a bearish journey to hit the weeks low at $0.01107 on the 25th. Currently, the trading volume sits at $10,359,980.28 as the price has experienced a further 6.62% decline for the past 24 hours.
INDICATORS
Bollinger Bands
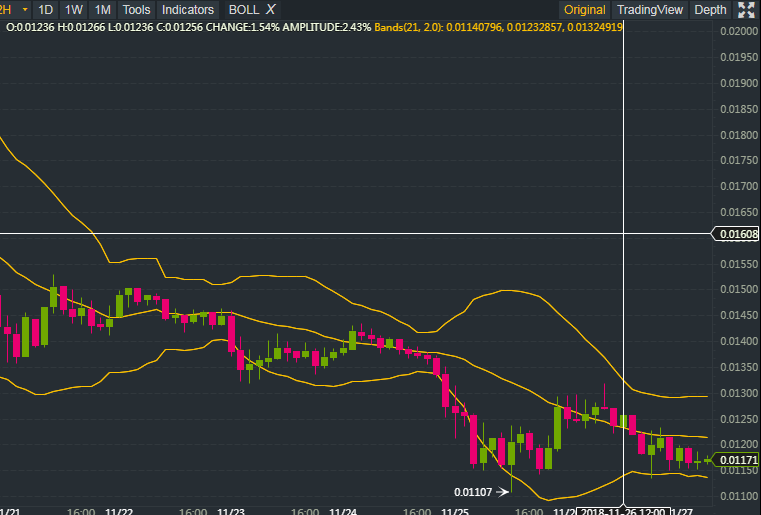 We are now in a period of lower volatility as compared to the past 2 days starting from the 24th to the 26th of November. As demonstrated by the chart above, the trend line has currently crossed the midline with a strong movement towards the lower band which is likely to bounce off to continue the symmetrical highs and lows which commenced on the 24th. Beyond the 24th, the bands are showing a period of low volatility spanning from the 22nd of November to the beginning of the week.
Relative strength index
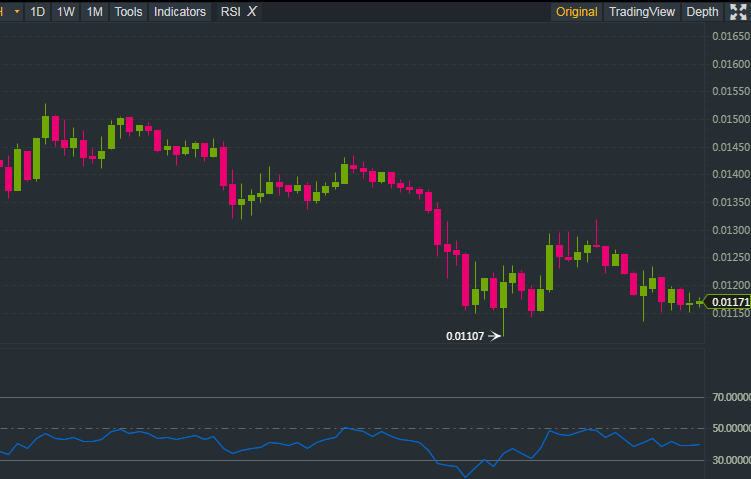 Since the 21st, the RSI has been oscillating below 50.0000, approaching strong overbought conditions during the weeks low on the 25th. Since then, the RSI trend line approached the midline before rebounding back to the current level which is in the middle of the 50.0 and 30.0 marks. The trend indicates for a typical bearish price movement which might be sustained for a few more hours to come.
Moving Average Convergence Divergence (MACD)
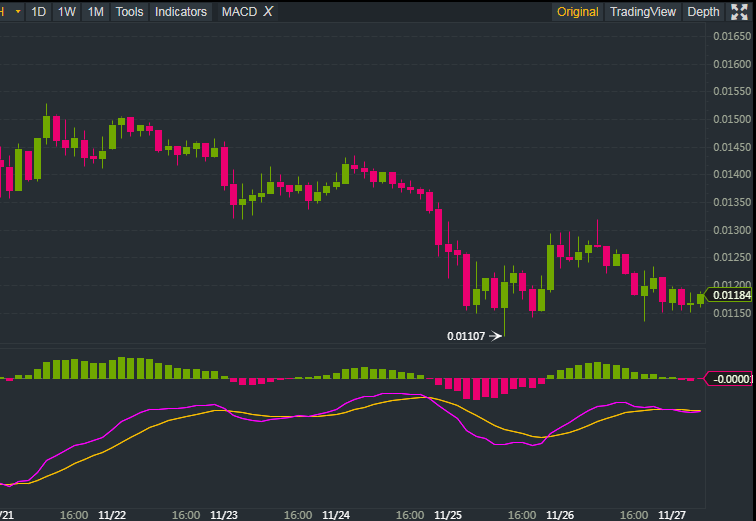 The Moving averages are indicative of the major highs and lows which have been seen during the course of the general bearish price movement in the past 7 days. Currently, the faster and slower moving averages are exhibiting convergence, with the faster moving average reversing to a bullish direction.
This is indicative of a bullish reversal marking the beginning of another short term bullish price movement. Looking backwards beyond today, the charts demonstrate a series of moving average convergence points which are reflective of the highs and lows which have been going along with the general downtrend.
Stochastic indicator
We are currently coming from an overbought zone which had been occupied starting from 16:00 pm on the 26th to 4 am today. All moving averages have a strong momentum approaching the midline at 50.0000. This is suggestive of an imminent uptrend. Like the MACD, the indicator has been consistent with the price trend as the past overbought and oversold conditions are demonstrating a close relationship with the marked highs and lows of the 7 day bearish price motion.
CONCLUSION
Tronix has shown a general price decline with a series of marked highs and lows amid the bearish price movement. Currently, the indicators are pointing towards another short term reversal which may well be part of a continued downtrend. However, Tronix has not been the only victim as more than 90 percent of the cryptocurrencies in the industry have been suffering under the oppressive bear’s regime.