TL;DR:
- Current price: The XRP token trades around $1.50 as of September 29, 2026, after touching an intraday high above $1.65 on September 23.
- Technical statement: Trader Michael Monten informed his community that investors should expect “a lot of green,” keeping the exact chart reserved for his private group.
- Historical precedents: The analyst reported accumulation in July 2024 ahead of the breakout from a seven-year pennant that drove the asset above $3 in November 2024.
Market analyst Michael Monten stated that XRP holders should be ready for an imminent, extended phase filled with green candles. According to a market report, the trader kept the exact chart structure reserved exclusively for members of his private trading community.
I wish I could give you this XRP chart set-up but I promised my group members I wouldn’t share it to the masses.
Let’s just say… get ready for green.
A lot of green.
— Crypto Michael (@MichaelXBT) September 29, 2026
Right when Monten issued his remarks, the price of XRP hovered around $1.50 across major exchanges. That level reflects a pullback from the intraday peak above $1.65 recorded on September 23, 2026.
Despite this retracement, the price remains positioned above the $1.25 to $1.30 support range established in mid-September. According to Monten’s cited posts, the recent price action represents routine volatility preceding a larger directional expansion within the broader market structure.
The trader did not include specific numerical price targets, defined resistance levels, or invalidation thresholds in his public commentary. Disclosures from his X account show that he has held spot positions since September 25, 2026.
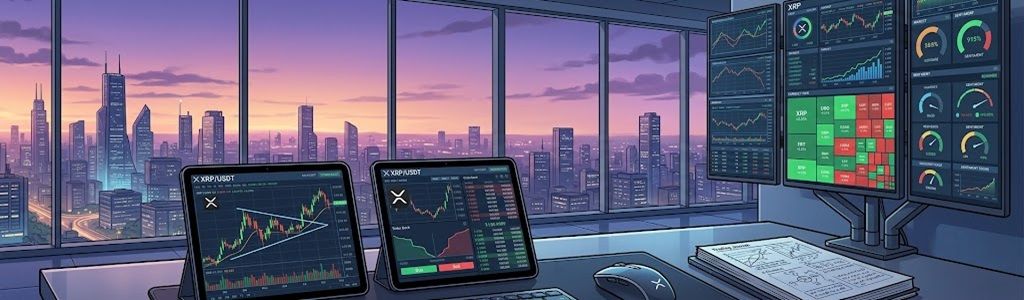
Technical trajectory of the asset and observed patterns
Monten initiated public coverage of the digital asset in mid-2024. In July of that year, while the token traded below $1, he highlighted the formation of a seven-year bullish pennant that preceded the November breakout above the $3 mark.
The broader market correction across 2025 and early 2026 pushed the price down to test lower levels. Records from May 2026 show the analyst identified a cyclical floor around the $1 mark, describing the asset’s behavior as a phase of technical compression.
On September 23, 2026, Monten suggested that both Bitcoin and XRP could outperform Ethereum over the short term. Two sessions later, the analyst noted that immediate overhead selling barriers could be cleared rapidly if trading volume confirms the trend.
The analytical model used by the trader relies on proprietary technical benchmarks he refers to as “yellow lines.” Market commentators emphasize that these tools represent discretionary charting interpretations that offer no guarantee of repeating outcomes in future cycles.
Trading volume and liquidity dynamics across centralized platforms will remain the primary metrics to track through the September 2026 monthly close. Market participants will watch closely to see whether price action confirms support at $1.30 or makes another run toward immediate resistance at $1.65 in the upcoming sessions.