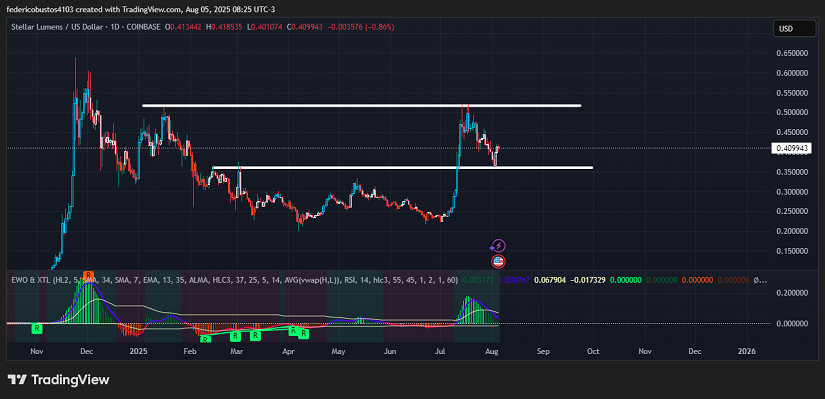
- XLM experienced a 130% rally since early July, surging from $0.22569 to a high of $0.52, a level now acting as strong resistance.
- After failing to break this resistance on July 18, the price corrected to $0.36, losing 3.17% over the past week.
- Indicators show clear signs of cooling off and validate an ongoing technical correction scenario.
Rising Demand, Strategic Partnerships, and Global Context
In recent weeks, Stellar (XLM) has benefited from fundamental drivers that supported its initial strong momentum. On July 2, the Stellar Development Foundation announced key advancements in its integration with MoneyGram, enabling international payments with stablecoins. This attracted speculative capital and revived the narrative of real-world adoption for cross-border payments.
However, this positive backdrop clashes with macroeconomic factors demanding caution: the recent strength of the US dollar and uncertainty around the Fed’s interest rate policy have kept institutional investors in conservative mode. Additionally, the broader crypto market is cooling off following Bitcoin’s correction from recent highs, draining some of the speculative liquidity that had fueled XLM’s rally.
While the fundamental potential remains strong, regulatory developments or a renewed Bitcoin rally will be critical to sustain demand in the short term.
Technical Analysis of XLM
The daily chart clearly outlines XLM’s technical story: the rally began on July 1 at $0.22569, reached a local high of $0.52 on July 18, and has since entered a corrective phase. The $0.52 resistance proved decisive; failed breakout attempts triggered profit-taking. The EWO, which accompanied the rally with growing green bars, now shows declining histograms, reinforcing the momentum exhaustion thesis. At this time, XLM is trading at $0.409943, down 0.86% over the past 24 hours.
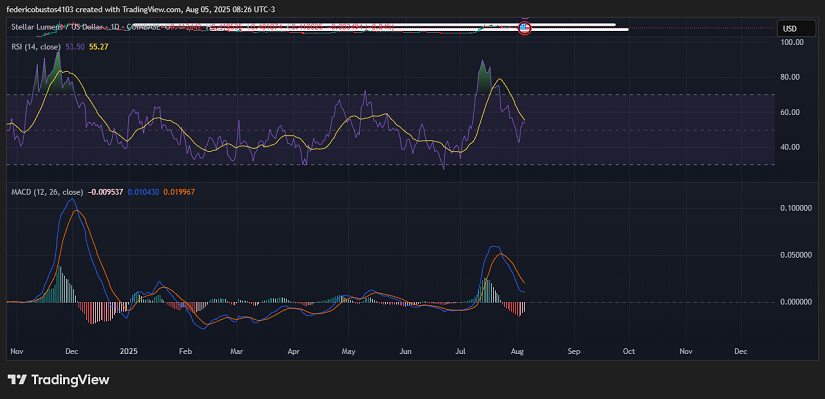
The RSI, which stayed in overbought territory for several days, has fallen to 53, confirming the corrective turn and suggesting there’s still room to decline without entering oversold conditions. Meanwhile, the MACD recently triggered a bearish crossover: the fast line (12) crossed below the slow line (26), and the histogram moved into negative territory, indicating selling pressure that could intensify. Volume supports this narrative: the peak of interest during the rally has decreased, pointing to weaker conviction to sustain elevated prices.
Conclusion and Scenarios
Technically, as long as the $0.36 support holds, the corrective phase fits within a healthy consolidation structure that could help absorb overbought conditions and rebuild momentum. If this level remains intact, XLM could stage a rebound toward intermediate resistance levels. However, a decisive breakdown below this zone would open the door to a further decline toward $0.30, a level that aligns with key June supports, potentially serving to contain a deeper drop.
Technical charts courtesy of TradingView.
Disclaimer: The opinions expressed do not constitute investment advice. If you are looking to make a purchase or investment, we recommend that you always do your research.
If you found this article interesting, here you can find more STELLAR News.