
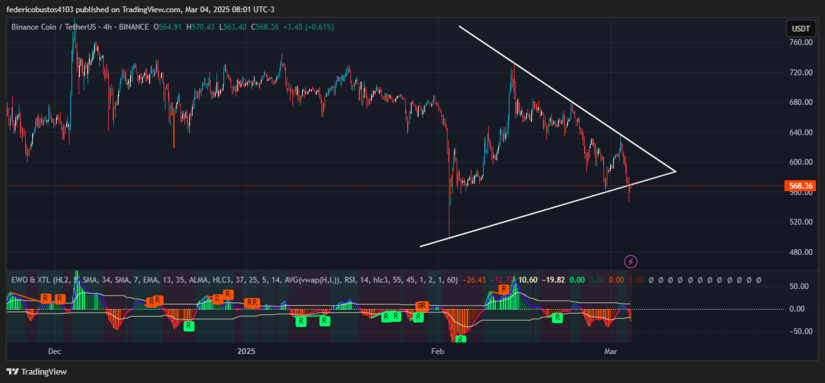
- The 4-hour chart of $BNB shows a bearish breakout from a triangular pattern, suggesting a deeper decline in the ongoing downtrend that began on February 14.
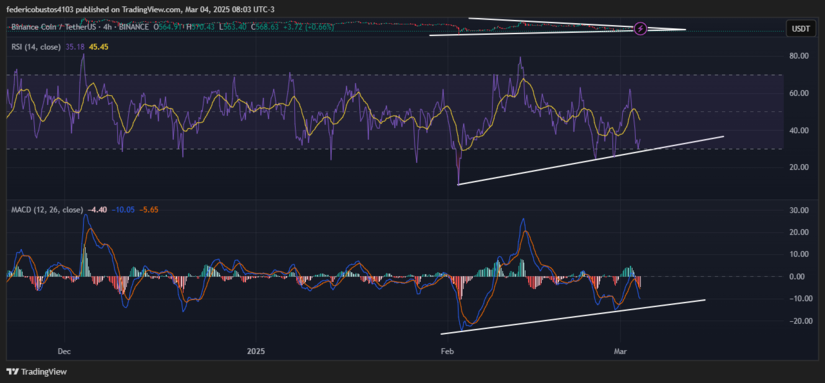
- Technical indicators, such as the EWO and RSI, display convergence, while the MACD signals a bearish crossover. Additionally, volume has decreased, reinforcing the idea of a correction.
- This scenario could indicate further downside movement towards key support levels around $500-$510, although demand levels, potentially influenced by Donald Trump, may play a role.
Trump Shakes the Crypto Market While BNB Suffers
Just a few days ago, U.S. President Donald Trump announced the creation of a strategic cryptocurrency reserve, including Bitcoin, Ethereum, XRP, SOL, and ADA. This announcement triggered a significant surge in the prices of these digital assets, with some rising by as much as 50%. However, the euphoria was short-lived, and amid strong criticism of Trump’s initiative, bearish pressure quickly returned, pushing Bitcoin and altcoins back into a correction phase.
Regarding $BNB, Binance’s cryptocurrency has shown moderate volatility in recent days. It is currently trading around $568.36, down 5.84% in the last 24 hours. Changpeng Zhao, founder of Binance, announced plans to strengthen liquidity within the BNB Chain ecosystem and warned about potential manipulation attempts through token donations.
BNB Technical Analysis
When analyzing the 4-hour chart of $BNB, a bearish breakout from the triangle is evident, an important signal backed by multiple indicators. Although volume has declined recently, it does not suggest overwhelming selling pressure, which could indicate a consolidation phase before a more definitive move. However, the convergence in the EWO (Elliott Wave Oscillator), slightly breaking the escape band, signals a shift in momentum. The shorter waves are aligning with a downward trend, reinforcing the breakout and suggesting further bearish continuation.
The RSI (14), currently at 35.18 and trending downward, is approaching oversold levels (below 30), which could attract buyers if the price continues to drop. However, its current level suggests there is still room for further correction before a potential rebound.
On the other hand, the MACD shows a bearish crossover, with the fast line at -10.05 and the slow line at -5.65, reinforcing the loss of bullish momentum. Meanwhile, the red histograms reflect increased selling pressure over the past few hours.
Conclusion and Scenarios
The short-term bearish trend remains dominant, supported by the RSI and MACD setup, which indicate a loss of bullish momentum and a potential scenario for further downside.
Given the triangle breakout and the possibility of a temporary pullback towards the ascending trendline, the next target could be in the $500-$510 zone, aligning with key psychological levels.
Technical charts courtesy of TradingView.
Disclaimer: The opinions expressed do not constitute investment advice.If you are looking to make a purchase or investment, we recommend that you always do your research.
If you found this article interesting, here you can find more BNB News.