- SUI has shown a strong increase in TVL, surpassing US $2.2 billion in July, along with a 145% growth in daily active users, reflecting real adoption and ecosystem expansion.
- The network upgrade in July improved throughput and lowered fees, facilitating dApp integration and attracting institutional interest.
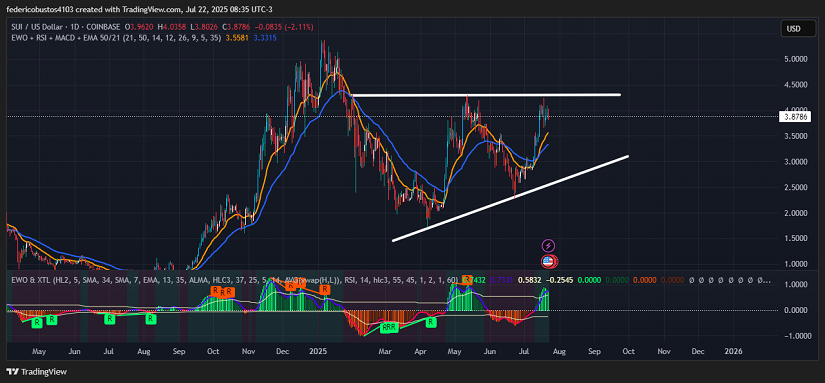
- The ascending triangle pattern with support at $3.00 and resistance at $4.35, together with positive technical indicators (EMA, MACD, RSI, and EWO), points to sustained buying momentum.
Expanding Ecosystem and Rotational Capital Potential
In June and July 2025, SUI consolidated its position within the crypto ecosystem thanks to significant developments. The protocol’s TVL reached new highs: first touching US $1.8 billion on June 16, driven by 90% growth in SuiLend, then surpassing US $2.2 billion by mid-July. This deployment captured part of the “rotational capital” flowing from Bitcoin’s all-time highs, underpinning SUI’s strength. By mid-July, the network experienced a 145% increase in daily active users, reflecting real and growing adoption.
Additionally, the July network upgrade improved throughput and lowered fees, boosting dApp integration and attracting institutional interest. The Bitlayer protocol, in collaboration with SUI, launched Peg-BTC (YBTC), expanding Bitcoin liquidity access within SUI. These milestones cement SUI as one of the most dynamic protocols in DeFi and Web3 in 2025. In fact, the developer community has doubled in just six months, ensuring continuous innovation.
If Bitcoin’s bullish trend holds through Q3, the inflow of fresh capital into SUI could further accelerate its expansion and help secure new all-time highs in the coming months.
Technical Analysis of SUI
Looking at the daily chart, an ascending triangle is clearly visible, with the dynamic support base aligning near $3.00 and immediate resistance around $4.35. SUI’s current price is $3.8786 (-2.11%). Recent volume confirms genuine interest in the accumulation zone, with significant spikes during the bounce from the June lows. The exponential moving averages (EMA 50 and 21) are positively sloped, with a crossover reinforcing buying pressure and validating the higher-lows structure. The Elliott Wave Oscillator (EWO) shows green histograms, indicating the wave structure does not yet signal clear momentum exhaustion.
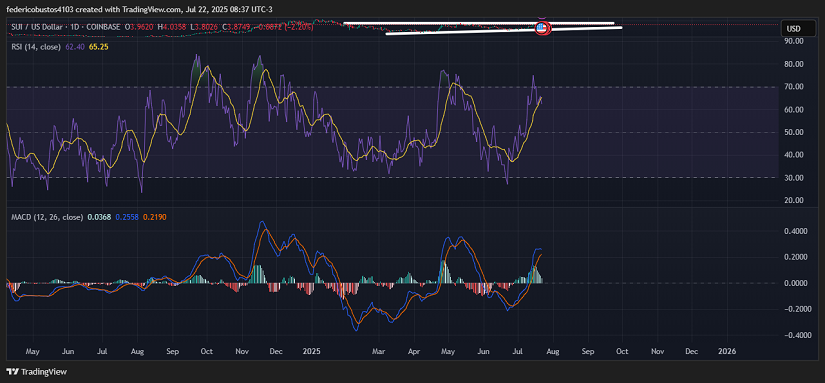
Meanwhile, the RSI (currently near 62) suggests that SUI still has room to move higher before entering a critical overbought zone. The MACD shows a bullish crossover since late June, with a positive histogram and diverging signal lines, reinforcing the continuation thesis. The current operational stance remains firmly bullish, with a buying bias on technical pullbacks.
Conclusion and Scenarios
With strong fundamentals, a favorable macro context, and clear technical signs of momentum, the base scenario for SUI remains decidedly bullish in the short to medium term. If the $4.35 resistance is broken decisively and confirmed with a daily close, the price will likely advance towards the $5.00–$5.30 zone as the next target.
–
Technical charts courtesy of TradingView.
Disclaimer: The opinions expressed do not constitute investment advice. If you are looking to make a purchase or investment, we recommend that you always do your research.
If you found this article interesting, here you can find more ALTCOINS News.