- The inclusion of Solana in the “strategic cryptocurrency reserve” announced by Donald Trump and the launch of SOL futures by CME Group reflect growing institutional interest in the cryptocurrency.
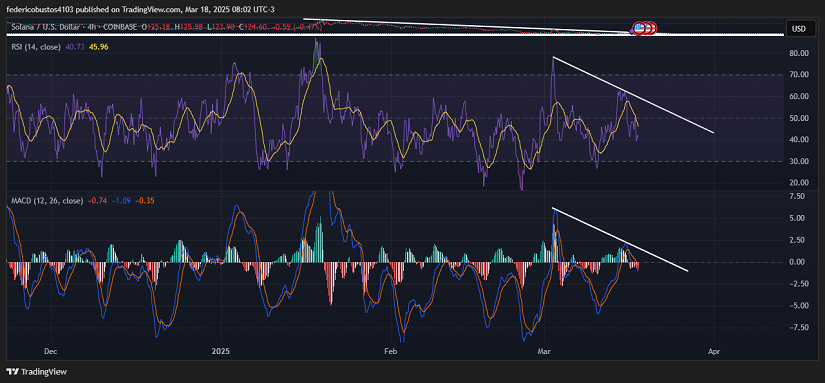
- The MACD continues to show resistance to recovery, while the RSI (40.73) remains in neutral territory with a bearish tilt. The EWO (Elliott Wave Oscillator) indicates a possible exhaustion of the bullish trend as it shows convergence.
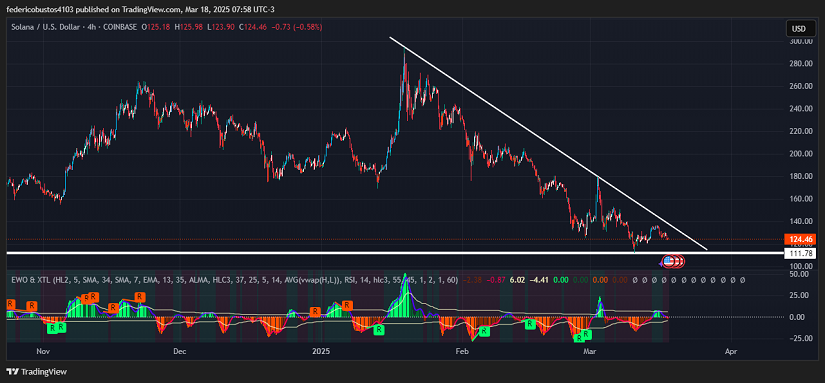
- SOL needs to decisively break above the downward trendline to confirm a trend reversal or it could retest the $111.78 support level.
Solana Gains Ground as the Market Watches
Over the past three weeks, Solana has been at the center of several events that have influenced its ecosystem and market valuation. On March 2, 2025, President Donald Trump announced the creation of a “strategic cryptocurrency reserve” in the United States, including assets such as XRP, Cardano (ADA), and Solana (SOL). The inclusion of Solana in this strategic reserve highlights its growing relevance and could impact its adoption and long-term market value.
On February 28, 2025, CME Group announced its intention to launch Solana futures contracts, which began trading yesterday, March 17. Two types of contracts are offered: one for 500 Solana coins and a “micro” contract for 25 coins. This move responds to the growing institutional demand for Solana-linked financial products.
Unfortunately, the market continues to face uncertainty due to macroeconomic factors, including the Federal Reserve’s interest rate policies, Trump’s protectionist stance, and Bitcoin’s volatility.
Currently, Solana (SOL) is trading at $124.46, down 2.68% in the last 24 hours.
Technical Analysis of SOL
On the 4-hour chart, Solana remains in a bearish structure, with strong resistance in the $140-$145 range and a key support level at $111.78. Although the price has shown some recovery in recent days, trading volume has not significantly increased, indicating that buyers have not yet fully taken control of the market. Selling pressure remains, and the downward trendline continues to act as a major barrier that SOL must break to confirm a reversal.
The Elliott Wave Oscillator (EWO) appears to have exhausted its bullish momentum in recent sessions. In fact, it has now entered negative territory, though it has not yet broken through the lower band.
The Relative Strength Index (RSI), currently at 40.73, is in neutral territory but showing a clear downward inclination. If it breaks below 40, it would confirm an increased selling interest.
The MACD lines (blue and orange) are hovering near the zero line, signaling market indecision. The downward trendline drawn over the MACD suggests that recovery attempts have been consistently rejected, reinforcing the idea that bearish pressure still dominates.
Conclusion & Scenarios
Solana is at a critical juncture. If it strongly breaks the $140-$145 resistance, it could trigger a bullish rally with targets at $160 and $180. However, if bearish pressure persists and SOL fails to hold above these levels, the price could retest support at $111.78. If this support is lost, further declines towards $100 or even lower levels would not be surprising.
The next few days will be crucial in determining SOL’s direction, as the market watches for confirmation of either a reversal or a continuation of the downtrend.
Technical charts courtesy of TradingView.
Disclaimer: The opinions expressed do not constitute investment advice.If you are looking to make a purchase or investment, we recommend that you always do your research.
If you found this article interesting, here you can find more SOLANA News.