TL;DR
- Solana ($SOL) has broken out of the bullish channel it had been respecting since the strong rally of over 90% that began on April 7.
- Technical indicators (EWO, RSI, MACD) are showing clear signs of bullish exhaustion and a loss of momentum.
- In the short term, everything points to a potential correction toward the support zone between $154 and $152, a key level that could define the next move.
Between Solana’s Growth and the Sector’s Instability
As of May 2025, Solana remains one of the most active networks in the crypto ecosystem, with a significant uptick in daily transactions, reaching 8.3 million on May 19, a 12% increase from the previous week. Projects like DRiP Haus, recently acquired by the aggregator Jupiter, have boosted the use of free NFTs, strengthening the community. Additionally, memecoins such as WIF and BONK have contributed to the network’s dynamism: WIF surged by 75% over the past month and BONK by 76%, with bullish projections for June.
However, the global crypto environment is facing challenges. Coinbase recently suffered a major security breach: hackers accessed customer personal data by bribing external contractors. Losses are estimated at up to $400 million, and the company declined to pay a $20 million ransom demand, instead offering a reward for information.
This incident reignites concerns about the safety of centralized exchanges and could cause temporary investor distrust, negatively impacting the overall market sentiment.
SOL Technical Analysis
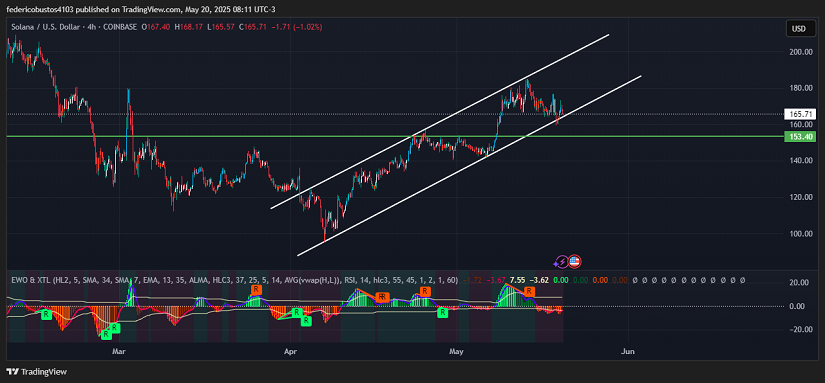
From a technical standpoint (4-hour chart), Solana has experienced a slight breakdown from the ascending channel it had maintained since early April. After reaching a high of $184, the price failed to consolidate and is now trading at $165.71, down 0.53% in the past 24 hours.
There is a noticeable drop in buying volume in recent candles, signaling a lack of conviction from buyers and suggesting the correction may continue. The Elliott Wave Oscillator (EWO) has crossed into negative territory, indicating a shift in momentum and suggesting that the recent rally may have come to an end.
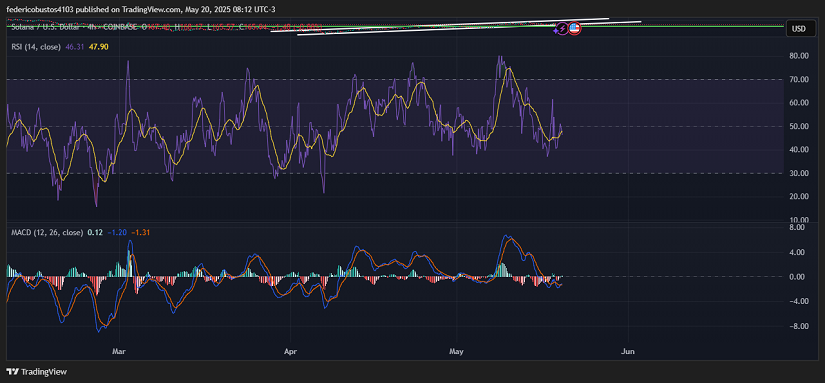
The Relative Strength Index (RSI) is currently at 46.31, signaling a loss of bullish momentum. This places it in a neutral zone, but the absence of buying pressure could foreshadow a sideways movement or even further correction if bullish support doesn’t emerge soon.
The MACD has flashed a sell signal, with a bearish crossover of the moving averages and negative histogram bars, reflecting a loss in bullish momentum.
Conclusion and Scenarios
All these indicators point to a likely short-term correction. The next significant support level lies between $154–$152. If the price respects this zone, it could consolidate before attempting another bullish move.
Was this breakout just a breather… or the beginning of a deeper correction? The next move will be critical.
Technical charts courtesy of TradingView.
Disclaimer: The opinions expressed do not constitute investment advice. If you are looking to make a purchase or investment, we recommend that you always do your research.
If you found this article interesting, here you can find more SOLANA News.