TL;DR
- Solana has shown signs of exhaustion after a bullish rally since June (+66%), with price correcting from $217 down to the current $203.
- The fundamental context remains supported by institutional demand and expectations of SOL ETFs, although technical momentum is weakening.
- The current technical structure suggests a possible drop toward the key support at $169, driven by a broader correction and loss of momentum.
What Is Supporting or Weakening Solana in Recent Weeks?
In recent weeks, institutional demand for Solana has remained solid. Strong accumulative interest has been observed, with large positions held by entities such as DeFi Development Corp, boosting the network’s credibility. In addition, the possibility of future ETFs backed by SOL—with applications submitted by firms like Bitwise and 21Shares—keeps traditional investors interested. Positive inflows into Solana have also been recorded, although the price faces resistance around $210–$211.
The arrival of the USD1 stablecoin to the ecosystem adds liquidity and could further stimulate DeFi usage. Moreover, the ecosystem’s Total Value Locked (TVL) has reached $34 billion, driven by platforms like Kamino, Jito, Jupiter, and Raydium, while accumulated interest from corporate treasuries now exceeds $900 million. However, despite these solid fundamentals—strong institutional backing, active technological adoption, and growing TVL—the bullish momentum seems to be more influenced by regulatory expectations (ETFs) and speculative inflows than by a sustained, organic expansion of daily usage.
Technical Analysis of $SOL
From a technical perspective, Solana shows a market structure with some signs of exhaustion after the rally that began on June 22, pushing price from $131 to a local high of $217 on August 29. Subsequently, the failure to hold above $210, along with the pullback, reflects waning buying strength. Its current price is $203, marking a +3.02% gain in the last 24 hours.
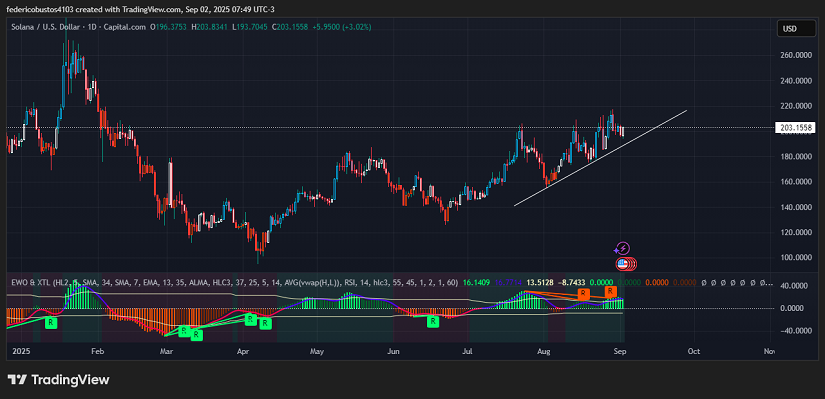
Volume confirms this reading: order flow has dropped noticeably during the corrective phase, signaling weaker bullish conviction and a greater tendency toward profit-taking. The EWO (Elliott Wave Oscillator) still shows positive bars, but they are contracting toward neutral levels, indicating a loss of momentum and a potential short-term bearish reversal.
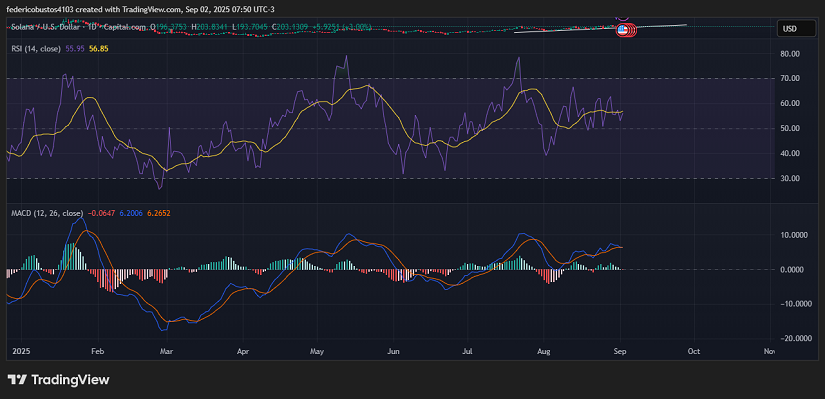
The RSI, hovering around 55, sits in neutral territory, but its slope suggests a gradual weakening of momentum, with room to fall toward 40 without entering oversold conditions. Meanwhile, the MACD adds to the bearish outlook, moving closer to a downside crossover. The weakening histogram also points to imminent seller dominance.
Conclusion and Scenarios
Overall, Solana’s technical structure looks vulnerable: a medium-term uptrend line on the daily chart remains intact but shows signs of a potential breakdown due to technical exhaustion. If this trendline is broken with volume, price could decline toward the $169 level, where liquidity is concentrated and a key prior support lies.
Technical charts courtesy of TradingView.
Disclaimer: The opinions expressed do not constitute investment advice. If you are looking to make a purchase or investment, we recommend that you always do your research.
If you found this article interesting, here you can find more SOLANA News.