
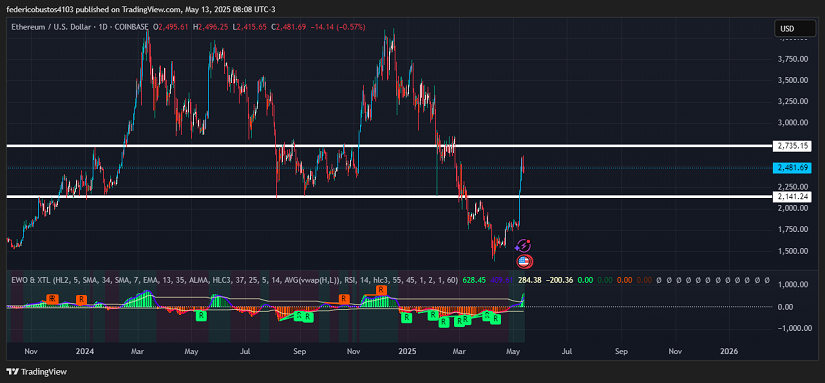
- Ethereum surged over 40% from May 8 to reach $2,624, but today it’s down 0.57% and currently trapped between support at $2,141 and resistance at $2,735.
- On a macro level, the trade agreement between the U.S. and China and the anticipated “Pectra” upgrade are generating positive medium-term expectations.
- Technical indicators are showing signs of exhaustion. Bearish divergence on the EWO, RSI in overbought territory, and a potential negative MACD crossover.
Pectra Upgrade and International Tailwinds
Over the past week, Ethereum has started to show clear signs of recovery after a cumulative drop of 66% over six months. The successful launch of “Pectra,” its most significant upgrade since “The Merge”, has reinforced the project’s narrative of constant evolution. This technical improvement aims to reduce transaction costs, optimize staking, and enhance user experience, all of which could lead to broader network adoption in the coming quarters.
At the same time, the provisional trade agreement between the United States and China has had a positive effect on the markets. The mutual reduction of tariffs, along with a 90-day pause in protectionist escalation, has renewed investor appetite for risk assets. This more favorable environment has also reached the crypto market, particularly benefiting Ethereum as a pillar of decentralized finance and smart contracts.
Technical Analysis of ETH
On a daily timeframe chart, Ethereum shows mixed signals but leans toward exhaustion of its rally. After a vertical climb of over 40% from May 8 to $2,624, the price has begun to show signs of weakness. It is currently trading at $2,481.69, down 0.57% on the day, right in the middle of the channel defined by support at $2,141 and resistance at $2,735, signaling a possible consolidation or reversal range.
Volume has slightly decreased in recent sessions, indicating a loss of momentum from the demand side after the initial breakout. The EWO (Elliott Wave Oscillator), while still in positive territory, shows a clear bearish divergence.
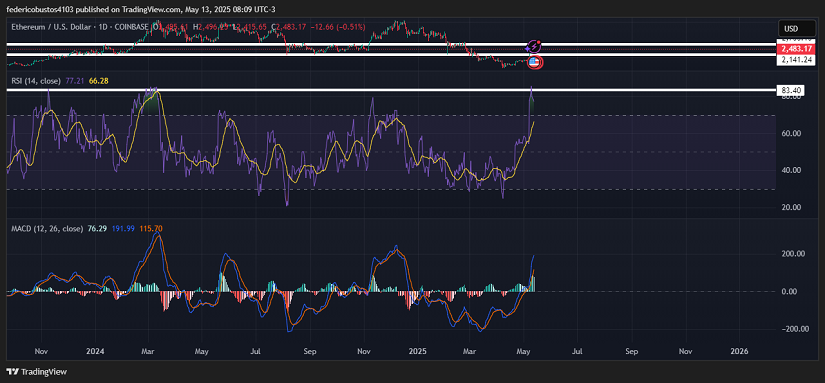
The RSI (Relative Strength Index) is at 77, indicating a clearly overbought condition on the daily timeframe. This type of reading often precedes trend pauses or technical pullbacks, as seen prior to the March 2024 correction. Additionally, a bearish divergence is beginning to form: while price continues to make higher highs, the RSI is flattening and starting to turn downward.
The MACD remains in positive territory, with a wide gap between the fast and slow lines, a reflection of the recent strong momentum. However, the histogram has started to contract, which suggests weakening bullish momentum. This signal becomes more significant considering that the MACD is approaching levels (around the 200 zone) that have historically preceded substantial corrections.
Conclusion and Scenarios
Ethereum may be entering a consolidation phase or technical pullback, with the $2,141 – $2,735 range acting as the key reference. A drop below support could open the door to a move toward $2,000, while a breakout above resistance might push the price toward $3,000. However, current indicators suggest that the end of the short-term bullish impulse may be near.
Technical charts courtesy of TradingView.
Disclaimer: The opinions expressed do not constitute investment advice. If you are looking to make a purchase or investment, we recommend that you always do your research.
If you found this article interesting, here you can find more ETHEREUM News.