
-
Ethereum is showing signs of exhaustion after its August peak, with the current price of $4,194 sitting very close to the support.
- Institutional demand and declining supply on exchanges remain key supports, but technical indicators reflect weakness and the possibility of further corrective moves.
- The chart structure suggests an imminent breakout scenario: a drop below $4,070 would likely accelerate losses toward $3,800, while a bullish breakout could reopen the path back toward $5,000.
Solid Fundamentals Driven by Institutional Accumulation and FED Monetary Easing
Over the past two weeks, Ethereum has been at the center of several developments reinforcing its position as one of the most promising digital assets. Citi released a report projecting a year-end price around $4,300, supported by tokenization growth, stablecoin adoption, and increasing institutional participation. At the same time, an estimated $3 billion worth of ETH has been withdrawn from exchanges since May, reducing liquid supply and theoretically providing upward pressure on prices in the medium term.
Interest in ETH spot ETFs also confirms that institutional flows have become a key driver for the market. However, recent days have seen net outflows that cast doubt on the immediate strength of this factor. From a macro perspective, the FED’s recent 0.25% rate cut eases some pressure on risk assets, including Ethereum, though uncertainty remains over how many more cuts will follow and how inflation and employment will respond. This moderate outlook provides support, but not enough to eliminate all risks.
Technical Analysis of $ETH
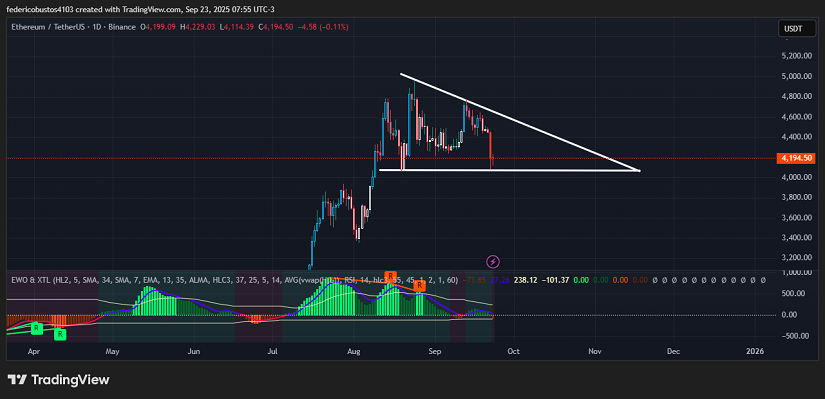
From a technical standpoint, Ethereum shows a clear pattern on the daily chart: a descending triangle formed after the all-time high of $4,956 on August 24. Since then, price action has displayed a sequence of lower highs while repeatedly testing support around $4,070. The current price stands at $4,194.50.
Volume during recent declines has been lighter, suggesting weak selling conviction, although moments of pressure have triggered massive liquidations that accelerated pullbacks. The EWO is printing increasingly weaker positive bars, confirming that bullish momentum has faded and the market may be entering a corrective phase.
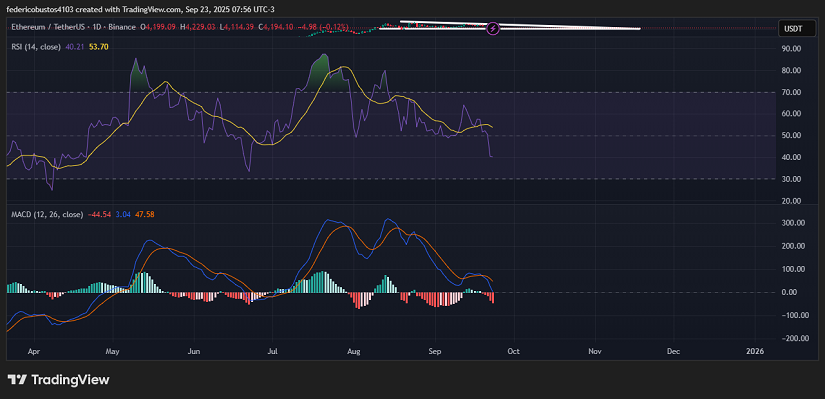
The RSI, currently near 40, shows a clear downward slope: it is not yet oversold, but its negative trajectory leaves room for a further decline toward the 30 level, where technical support may emerge. Meanwhile, the MACD reflects weakness, with a shrinking histogram and moving averages showing bearish convergence over the past sessions.
Conclusion and Scenarios
Ethereum’s technical outlook is fragile and favors the case for an additional correction. A breakdown below $4,070 would quickly open the door toward $3,800, an area of prior liquidity and buying activity. In contrast, if support holds and buyer volume increases, Ethereum could break upward from the triangle and retest the $5,000 zone, though this scenario requires a strong external catalyst. For now, patience and waiting for a clear confirmation appear to be the most prudent strategy.
Technical charts courtesy of TradingView.
Disclaimer: The opinions expressed do not constitute investment advice. If you are looking to make a purchase or investment, we recommend that you always do your research.
If you found this article interesting, here you can find more ETHEREUM News.