
- Strong Selling Pressure and Institutional Impact: Ethereum spot ETFs have recorded significant capital outflows, reflecting institutional disinvestment and a global “risk-off” sentiment.
- Technical Weakness and Ongoing Correction: ETH remains in a correction phase, with the price around $2,798 and critical resistance at $3,374; indicators such as RSI and MACD confirm the bearish pressure.
- Volatility and Reduced Network Activity: Derivatives liquidations and mass deleveraging have amplified volatility, while network activity declines, indicating lower real usage of Ethereum.
Institutional Impact, Deleveraging, and Market Weakness
In recent weeks, Ethereum has experienced a significant decline, breaking key support levels as the overall market sentiment turned “risk-off”. At the beginning of December, the price hovers around $2,800, reflecting strong selling pressure and increasing global risk aversion.
A central factor behind this pullback has been capital outflows through Ethereum spot ETFs. On November 5, these products registered a net outflow of $118.5 million, and weeks earlier ETFs had suffered outflows exceeding $1.4 billion.
At the same time, liquidations and massive deleveraging in derivatives markets amplified volatility. Many leveraged positions betting on an ETH rebound were forced to close, generating additional selling pressure. This deterioration in flows and demand combined with a decline in network activity: the number of monthly active addresses and transaction fees decreased, indicating lower real usage of the network during this period.
The result is a significant correction in ETH’s price, reflecting not only a temporary market drop but also a broader adjustment that includes institutional capital withdrawal, lower network activity, and weakened short-term technical fundamentals.
Technical Analysis of $ETH
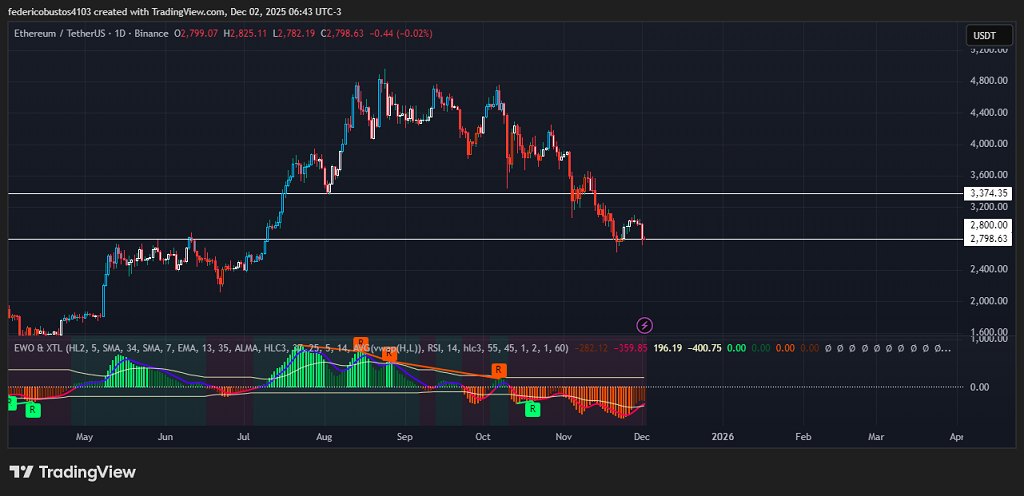
From a technical perspective, Ethereum remains clearly in a correction phase. The current price of $2,798.63, just above the psychological and technical support at $2,800, indicates that the market is still evaluating whether this level can hold. The downtrend that started on October 7, when ETH fell from $4,755 to $2,623 on November 21, shows that recovery attempts have lacked conviction, stalling around $2,798. The immediate key resistance is at $3,374, a level ETH must overcome to consider a trend reversal.
Volume has declined in recent sessions, showing a lack of buyer conviction. The Elliott Wave Oscillator (EWO) remains in negative territory, although some recent bars show a slight decrease in bearish pressure, which could set the stage for a short-term technical rebound.
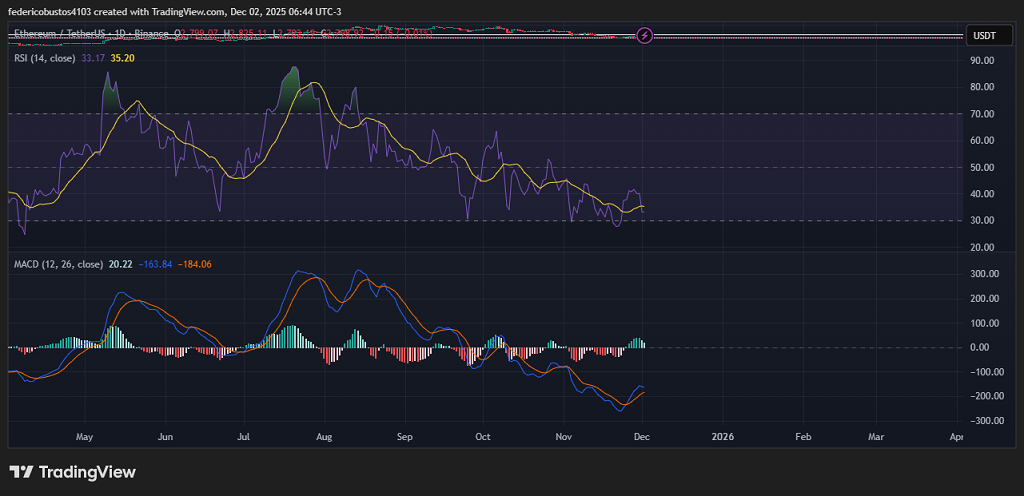
The RSI (14) is near oversold territory (33.17), but still with room to move and a negative slope, indicating that despite recovery attempts, buying strength remains weak. The MACD, with its signal line below zero and emerging green histograms, confirms the downtrend.
Conclusion and Scenarios
$ETH remains within the range of $2,500–$3,374, with predominant bearish pressure. A daily close above $3,374 accompanied by increased volume could trigger a technical rebound toward $3,600 and $3,800.
Conversely, if it breaks the intermediate support at $2,700, the correction could deepen toward the technical target of $2,500. Until Ethereum defines its position within this range, it is prudent to exercise caution and avoid anticipating moves.
Technical charts courtesy of TradingView.
Disclaimer: The opinions expressed do not constitute investment advice. If you are looking to make a purchase or investment, we recommend that you always do your research.
If you found this article interesting, here you can find more ETHEREUM News.