- Chainlink ($LINK) is experiencing a slight rebound after hitting the $10 level, a key technical support, and is currently trading at $11.543 with a +0.82% increase over the past 24 hours.
- The price has dropped more than 60% since peaking near $30 in December 2024, mirroring the broader bearish trend across the crypto market.
- Declines in major indices like the S&P 500 and Nasdaq, as well as in Bitcoin, highlight a tense macroeconomic environment that limits the upside potential of altcoins like LINK.
Global Sell-offs, Institutional Fear, and a Risk-Averse Market
The global macroeconomic outlook is working against the crypto market. Over the past week, major stock indices have suffered sharp corrections: the S&P 500 dropped by 9.96% and the Nasdaq fell by 9.80%, indicating a strong wave of risk aversion among investors. These losses are a direct result of new tariff policies introduced by President Donald Trump, which have intensified trade tensions between the U.S. and both Asia and Europe.
As a result, markets are under pressure and risk assets, including Bitcoin which fell 6.44% this week, are being dragged down.
In the case of Chainlink, despite the growing adoption of its technology in DeFi projects and its essential role as a blockchain oracle provider, institutional capital has pulled back. Fear, uncertainty, and technical selling are dominating the current landscape. While LINK remains a key player in Web3 infrastructure in the long run, the short-term outlook is shaped by the market’s overall weakness.
Technical Analysis of $LINK
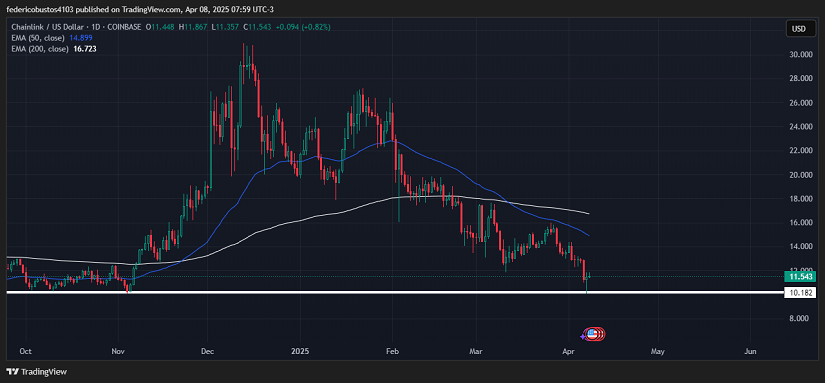
From a purely technical standpoint (1D), $LINK is in a critical zone. After nearly reaching $30 in December 2024, it began a sharp correction that took it down to test the key $10 support level on April 7. Currently trading at $11.543, it has posted a slight 0.82% recovery in the last 24 hours, which could be seen as an early attempt at a technical bounce.
The moving averages clearly show weakness: the 50-period EMA stands at $14.899 and remains below the 200-period EMA at $16.723, confirming the bearish crossover that has persisted for months. This structure continues to weigh heavily on any attempt at a sustained recovery.
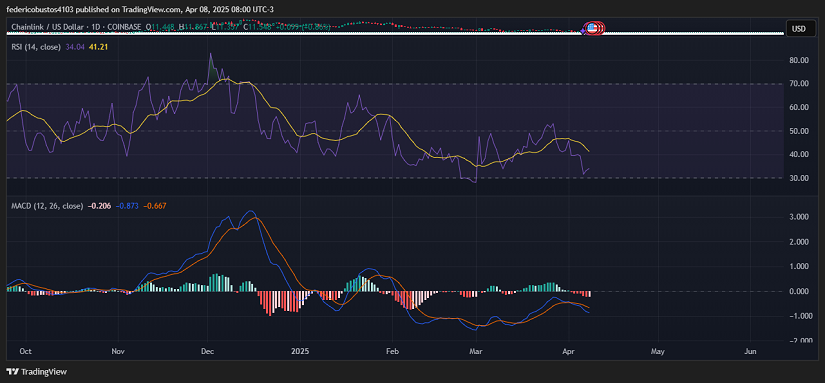
The RSI sits at 34.04 and has just bounced before entering the oversold zone, which might be interpreted as an early sign of technical relief, although still very weak.
However, the MACD has yet to show any convincing signs of recovery: its lines remain crossed in negative territory and the histogram is still red, reflecting that bearish pressure is still dominant. Without a shift in market structure or a significant increase in trading volume, this bounce appears limited and unconvincing for now.
Conclusion and Scenarios
Chainlink is at a pivotal moment. It has touched a key technical support and responded with a modest rebound, but the global context isn’t helping: the weekly drops in both indices and Bitcoin reflect a fearful market weighed down by political and economic tensions. Technically, the price needs to break above the 50 EMA (a dynamic resistance) with volume in order to show real signs of recovery. If the $10 support level breaks, the bear market could intensify even further. For now, caution and close monitoring are essential.
Technical charts courtesy of TradingView.
Disclaimer: The opinions expressed do not constitute investment advice. If you are looking to make a purchase or investment, we recommend that you always do your research.
If you found this article interesting, here you can find more CHAINLINK News.