- The technical structure of CHAINLINK (LINK) remains bearish, with the price showing weakness in stopping the correction that began after the local high in August .
- Indicators (RSI, MACD, EWO, and volume) still do not confirm a bullish reversal, maintaining a high probability of continued downside.
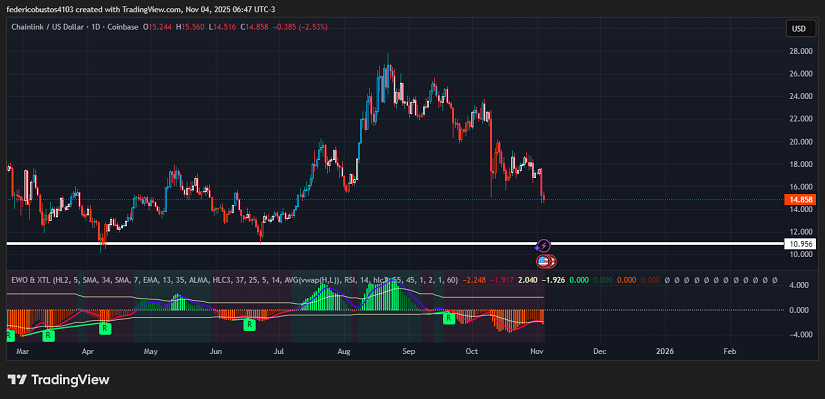
- If selling pressure persists, the price may seek liquidity in the key support zone between $11.00 and $10.95, where a more solid technical rebound could occur.
New CCIP Integrations and Developments Strengthening Chainlink’s Demand
Chainlink has strengthened its position as a key infrastructure layer for interoperability and tokenization, with major milestones at both the technological and institutional levels. On October 29, Chainlink announced new CCIP integrations across multiple networks, including Arbitrum, Base, BNB Chain, Polygon PoS, and Optimism, expanding the reach of its cross-chain interoperability protocol. These integrations further consolidate CCIP as the preferred standard for secure transfer of data and assets across blockchain ecosystems.
Institutional adoption also gained momentum after confirmation that more financial entities are testing tokenization solutions built on Chainlink. On October 22, Sergey Nazarov highlighted that several capital markets institutions are in advanced testing phases with CCIP to connect traditional banking infrastructure with blockchain, particularly in projects involving real-world assets (RWA).
However, despite the strong technological progress and rising institutional interest, speculative capital inflow into altcoins remains limited due to the broader crypto market correction. Therefore, while fundamental adoption trends support a bullish outlook for LINK in the mid-term, the short-term environment continues to show low liquidity and bearish pressure on price.
Technical Analysis Of $LINK
Since the $27.88 recorded on August 22nd, LINK has dropped over 45%, currently trading around $14.858. The trend is clearly bearish, marked by a sequence of lower highs and lower lows. Volume supports this view: there is no sign of a meaningful increase in buying interest that would suggest accumulation, only continued profit-taking and distribution following the 156% rally that began on June 21.
The EWO (Elliott Wave Oscillator) remains in negative territory with no clear bullish divergences, reinforcing that bearish momentum dominates and that no exhaustion phase has been confirmed.
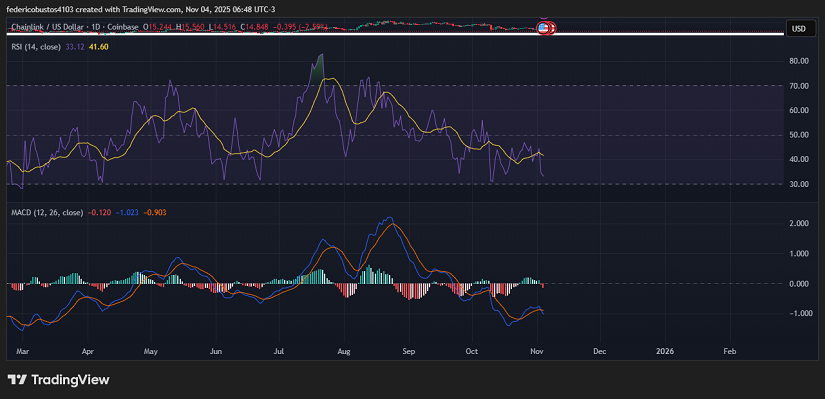
The RSI (14) is hovering around 33, approaching oversold territory; this may allow a technical rebound, but without a bullish divergence or a break above the 45–50 level, it is insufficient to validate a trend reversal. Meanwhile, the MACD histogram remains negative with no bullish crossover between MACD and the signal line, confirming that momentum still favors the bears.
Conclusion and Scenarios
Overall, the technical indicators do not show any solid signs of a trend reversal. If current selling pressure continues, the most likely scenario is an extension of the correction toward the $11.00–$10.95 support zone, where a strong concentration of liquidity lies. This is where more aggressive buyers may step in and trigger a significant rebound.
Technical charts courtesy of TradingView.
Disclaimer: The opinions expressed do not constitute investment advice. If you are looking to make a purchase or investment, we recommend that you always do your research.
If you found this article interesting, here you can find more CHAINLINK News.