TL;DR
- BNB is currently trading at $680.30. Over the past 24 hours, it has posted a positive return of 0.89%.
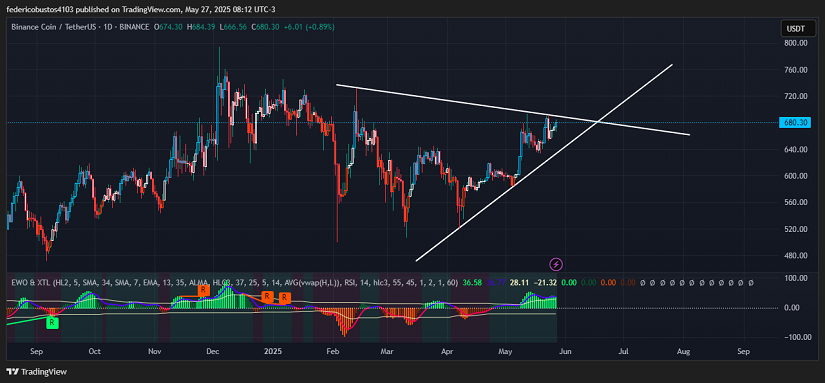
- Following an 18% rebound from the triangle support on May 5th, BNB reached $693 on May 12th and is currently in a consolidation phase.
- Technical indicators such as the RSI, MACD, and EWO suggest that bullish momentum is still present, potentially leading to an upside breakout from the triangle.
Expanding Ecosystem and Favorable Macroeconomic Context
In recent weeks, BNB has shown notable strength, supported by solid fundamental factors. The BNB Chain network has surpassed 2 million monthly users and reached 8 million daily transactions, reflecting growing demand and activity within its ecosystem.
This growth aligns with a favorable macroeconomic environment for cryptocurrencies. Bitcoin’s rally above $110,000 (reaching a new all-time high) has improved overall market sentiment, benefiting altcoins like BNB.
In addition, the recent “Maxwell” hard fork has sparked positive expectations, with analysts even projecting a short-term price target of $750 for BNB. It appears that the combination of rising adoption, network upgrades, and a bullish macro backdrop reinforces the positive outlook for BNB.
Technical Analysis of BNB
Since early April, BNB has been forming an ascending triangle pattern. After bouncing off one side of the triangle at $589, the price surged 18% to reach $693 on May 23. Currently, BNB is trading at $680.30 (+0.89% in the last 24 hours), consolidating gains and preparing for a potential breakout move.
During the rally, trading volume increased significantly, indicating strong buying pressure. Although it has slightly decreased during the consolidation phase, it remains above average, suggesting continued investor interest. The Elliott Wave Oscillator (EWO) remains clearly in positive territory, signaling a bullish trend and potentially breaking out of resistance bands. No bearish divergences are observed, which supports the possibility of a continued upward move.
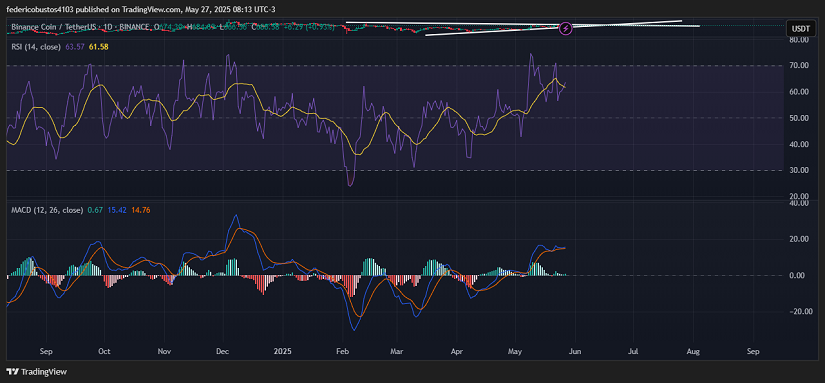
The Relative Strength Index (RSI) is around 63, below the overbought zone and showing a bullish pattern, indicating there is still room for further gains before a correction (>70) might occur.
The MACD remains in positive zone and, although it hasn’t yet reached the December level, the upward curves reflect a consistent recovery. The fast line has not yet crossed the slow line, suggesting the market is gaining strength.
Conclusion and Scenarios
Technical indicators reinforce the probability of a bullish breakout from the triangle. If BNB manages to break out with increased volume, the next target is projected in the $732 to $761 range.
With solid fundamentals and aligned technical signals, BNB appears well-positioned to extend its rally.
Technical charts courtesy of TradingView.
Disclaimer: The opinions expressed do not constitute investment advice.If you are looking to make a purchase or investment, we recommend that you always do your research.
If you found this article interesting, here you can find more BNB News.