
TL;DR
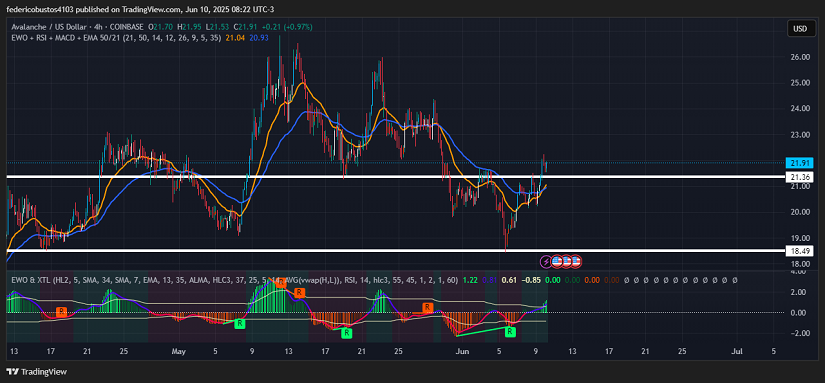
- AVAX has respected the key support at $18.49, bouncing strongly (+18%), breaking the resistance at $21.36, and showing good recovery.
- Technical indicators (EWO, RSI, MACD) reflect clear bullish strength and recent positive crossovers, indicating a possible sustained upward continuation.
- Fundamentally, growing institutional adoption (VanEck, real asset tokenization) and the gaming ecosystem boost with MapleStory are generating solid and sustained demand and active use of the Avalanche network.
Avalanche Among Institutions, Gaming, and a Potential FED Pivot
Avalanche has strengthened its fundamental foundations. Notably, VanEck launched a $100M “PurposeBuilt” fund aimed at projects on the network, focusing on real asset tokenization, gaming, and AI. The implementation of the MapleStory Universe has activated the ecosystem, generating over 1 million daily transactions. Additionally, institutional adoption is increasing with initiatives in tokenized real estate, moving trillions in real assets over Avalanche.
On the macroeconomic front, the crypto market is watching the Federal Reserve’s meeting on June 17-18, where a potential rate cut is being debated due to mixed inflation and employment data. Investors expect stability or a decrease in rates, which would increase liquidity in risk assets like AVAX. If the FED cuts rates earlier than expected, it’s expected to give an additional boost to cryptocurrencies.
Thus, Avalanche benefits from a strong synergy between real adoption, institutional backing, and a favorable macroeconomic environment, where the FED’s rate-cut expectations could provide an additional bullish catalyst.
TECHNICAL ANALYSIS OF AVAX
AVAX is currently trading at $21.91, just above a key resistance zone. Volume has exceeded average levels during recent breakouts, indicating buying intent. The EWO is now in positive territory, confirming growing bullish momentum and supporting the current buying pressure.
Additionally, the 21-period and 50-period exponential moving averages have just crossed upwards, which could confirm a short-term trend reversal (starting in mid-May). This crossover is typically interpreted as a positive technical signal, anticipating stronger bullish momentum if it successfully consolidates above resistance.
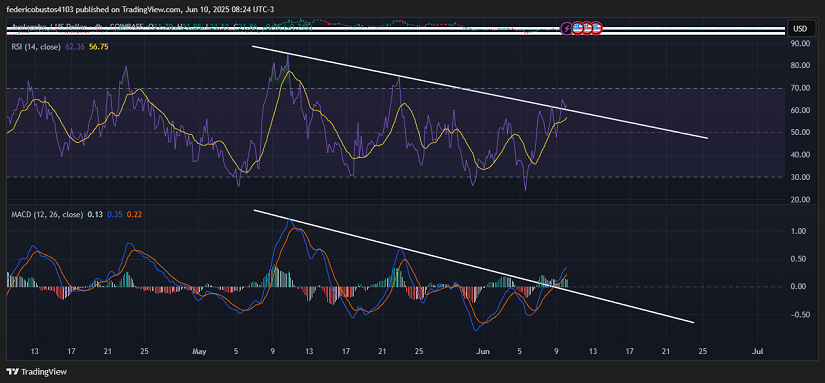
On the 4-hour chart, the RSI is at 62.36 and continues to rise, showing increasing strength in the buying momentum, even breaking through the downtrend line. The MACD has already crossed the signal line and is in positive territory, confirming the momentum shift. Both indicators reinforce a bullish outlook, pointing to continued recovery in AVAX.
CONCLUSION AND SCENARIOS
The technical and fundamental outlook for Avalanche aligns with a bullish perspective. The ecosystem shows clear signs of real and institutional adoption, while technical indicators confirm a favorable momentum shift. If AVAX defenitively breaks above the current resistance and consolidates above it, the next target could be in the $24–25 zone. Additionally, a FED rate cut would act as an additional catalyst for the upside.
Technical charts courtesy of TradingView.
Disclaimer: The opinions expressed do not constitute investment advice. If you are looking to make a purchase or investment, we recommend that you always do your research.
If you found this article interesting, here you can find more AVALANCHE News.