TL;DR:
- The SuperTrend indicator flipped to a bullish setup following the price move above $78 recorded this past June 30.
- Transfer volume within the blockchain network recorded a 120.5% increase over the last thirty days.
- The Real-World Assets (RWA) sector within this network’s ecosystem reached a valuation of $3.03 billion.
Once again, Solana captures the attention of market traders after triggering a technical buy signal by trading above $78 this past June 30. The asset’s behavior in the coming days will determine if the momentum has enough strength to consolidate a structural recovery.
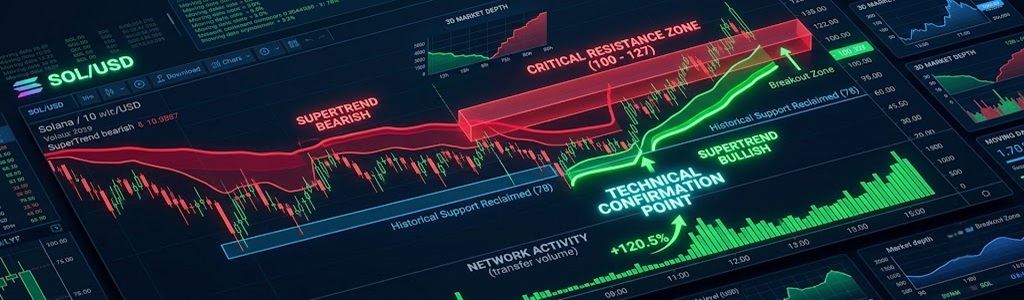
2/7 The SuperTrend indicator flipped bullish after Solana broke above $78 on June 30.
That puts the broader trend back on the buy side.
But technicals are only part of the story. On-chain activity also points to improving market conditions.https://t.co/iybH1VaMNT
— Ali Charts (@alicharts) July 10, 2026
The SuperTrend indicator shifted its status to green after the token broke through the $78 barrier at the end of June. Market analysts suggest that this shift puts short-term trend trackers on high alert for potential price variations.
The movement above $78 returned the price to a historical support range. According to chart evaluations in the technical report, this specific level served as a foundation for significant rallies in previous market cycles, accumulating an advance of over 260% on one occasion.
The appearance of an isolated buy signal does not represent a definitive confirmation of a macro shift. Traders’ readings indicate that the asset requires steady demand above support to keep its acceleration active.
The resistance range between 100 and 127 dollars
Now, the trading price is approaching its main technical congestion zone. A clean cross above the band extending from $100 to $127 could strengthen the buyers’ current structure.
If the price clears this margin, $127 would become the first relevant upside target. Market analysts’ interpretation points out that a daily close above this ceiling would offer clear validation for capital flows. Conversely, a rejection in this zone would slow down the recovery, causing a pullback toward the $78 base.
Activity within the blockchain also shows positive variations in its fundamental metrics. The Real-World Assets (RWA) sector integrated into the network totaled $3.03 billion at the close of the last evaluated period.
On-chain activity records reflect a 120.5% increase in transfer volume over a thirty-day span. Data platform analysts suggest that the expansion in ecosystem utilization adds fundamental backing to discussions regarding the asset’s valuation.
Long-term projections contained in the technical report propose scenarios toward $233.8, provided the structure retains its firmness. Such a move would require a revaluation of over 190% from current support levels. Extended evaluations mention the $456 mark, though analysts warn that this latter scenario depends on a favorable macroeconomic environment and does not constitute a confirmed short-term target.
The market will monitor the behavior of daily transaction volume over the upcoming weekly closes to assess the consistency of the reclaimed support.