Solana prices roughly doubled after sinking to 2022 lows in the wake of FTX insolvency. Rising 195% from December lows, SOL holders found reprieve.
As the coin recoils, syncing with the development across the broader crypto markets, the coin is just 40% shy from November highs and pre-FTX range.
It is a big shot-in-the-arm boost for SOL traders. From the chart, if buyers manage to hold above immediate support at around $23, the uptrend will be valid even with prices trading below the middle BB.
There would be even more opportunities for gains if bulls flow back, reversing the weekend’s losses and propelling the coin above the bull flag at $27.
This would mark a bullish continuation formation that may see SOL shake off the effects of FTX and Alameda Research.
FTX and Alameda Research Crisis
SOL is rallying partly because of Bitcoin’s resurgence. The rising tide, triggered by BTC’s broad recovery, is lifting all altcoins; SOL is one of the primary beneficiaries. Even though SOL is marching higher, it is clear that the pump could be driven by technical factors.
In 2022, SOL dropped by over 90% from 2021 peaks partly because of its alignment with the now-defunct FTX and its trading arm, Alameda Research.
Following the bankruptcy of FTX and the arrest of Sam Bankman-Fried, SOL caved below $10 as traders and investors exited the coin. Following suit are projects in DeFi and NFTs opting out.
Everlend said they were shutting down the protocol due to low liquidity.
We are deeply saddened to announce that as of today our team has decided to close down https://t.co/UiTuuSdyrB and won’t continue its development
— Everlend (@EverlendFinance) February 1, 2023
They asked clients to withdraw funds because insisting on pressing on and keeping operations going would be a “gamble”.
Solana Technical Analysis
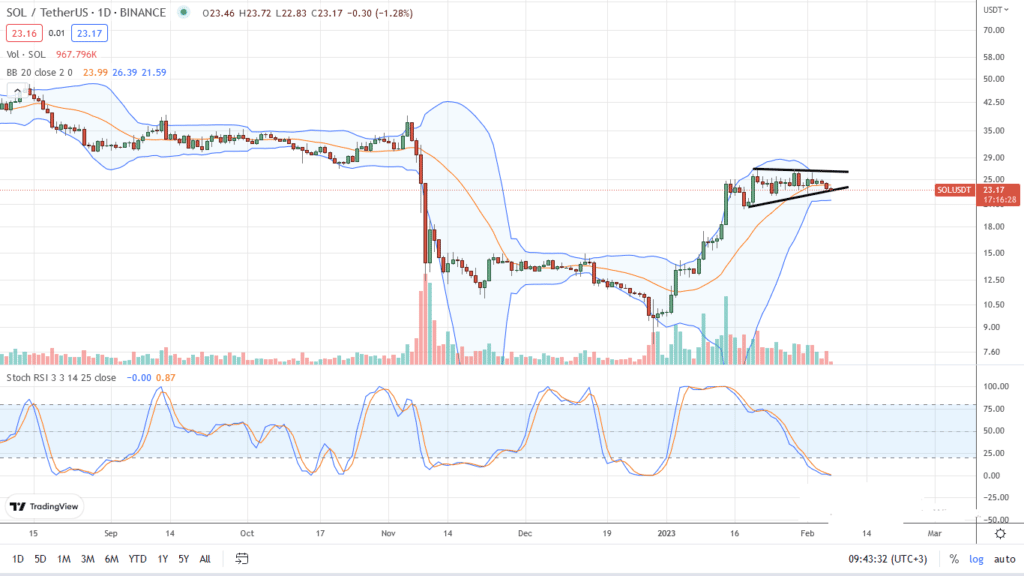
Losses below this line could see SOL drop to the support of January 14 at $18. This pattern will allow traders to trade the bear breakout, riding the emerging trend and confirming the losses of January 30.
Conversely, this preview can only change if bulls reject the selling pressure, breaking above $27. As it is, conservative traders can only watch until there is a clear trend definition.
Technical charts courtesy of Trading View. Disclaimer: Opinions expressed are not investment advice. Do your research.If you found this article interesting, here you can find more Solana news