The Solana (SOL) prices are roughly 50% after tanking to as low as $15 in mid-June. Technically, the downtrend remains from a top-down preview, but there are hints of strength in the short-to-medium term.
As it is, traders can look for entries for the long term, riding with the trend that emerged in the tail-end of June. However, since trading volumes are relatively low and fundamental headwinds might slow optimistic buyers, traders should proceed cautiously.
The immediate resistance levels remain at $22 and $25, marking June and April 2023 highs, respectively. Conversely, $16 is an important support level traders should actively watch.
SOL under Pressure
SOL has been among the worst performers in the last few trading months. Following the liquidation of FTX and Alameda Research, SOL prices flash-crashed as traders and holders feared the worst.
Presently, SOL is still a shadow of what it used to be at the 2021 peaks when it proved a worthy challenger for Ethereum. Despite falling prices and valuation, Solana offers high scalability and low transaction fees.
Even so, its decentralized finance (DeFi) and non-fungible token (NFT) ecosystem has drastically shrunk as projects opt for alternative platforms and investors pull out funds.
The situation worsened when the United States Securities and Exchange Commission (SEC) said SOL, the native currency of Solana, is an example of an unregistered security. Subsequently, SOL’s liquidity has been impacted as several mainstream exchanges, including Revolut and Robinhood, have revealed plans to delist the coin.
Solana (SOL) Price Analysis
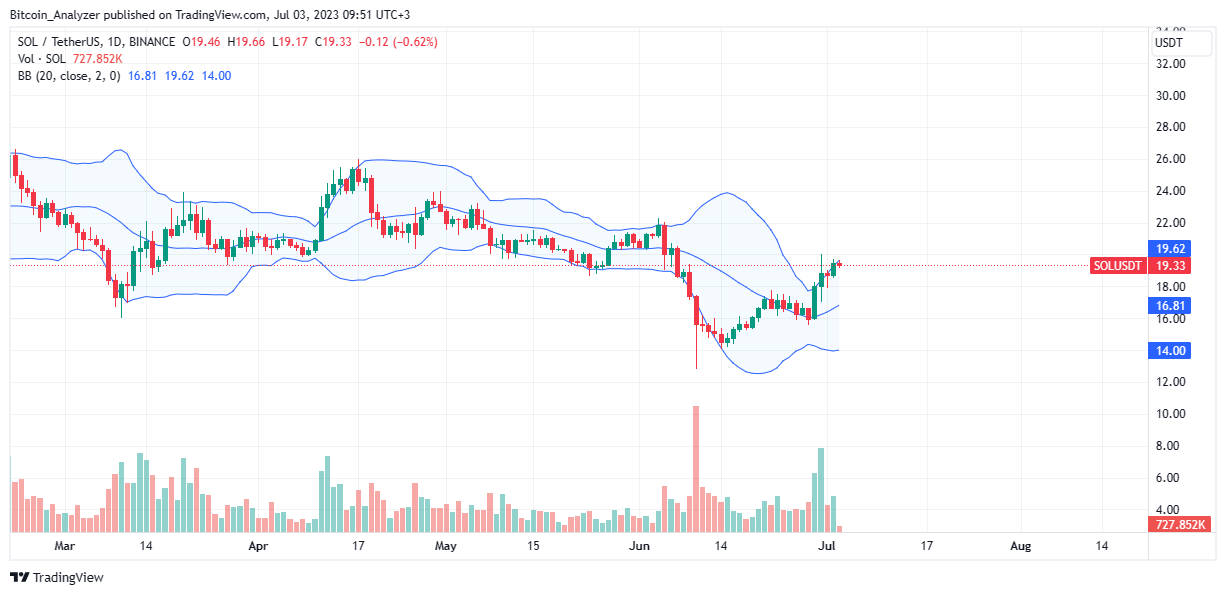
From the daily chart, SOL is up roughly 50% from June lows of $13. The coin is bottoming up, powering higher. The uptrend momentum is strong as bull bars edge along the upper BB, suggesting participation and strength from optimistic buyers. At the same time, the divergence from the middle BB—that is, the 20-day moving average- means high volatility.
The June 29 wide-ranging bull bar anchors the current preview. If prices are above $16, traders can look to buy in long on dips, targeting $22, the first resistance level. If bulls push on, the coin can float higher to $25 or April 2022 highs.
This preview is valid from an effort-versus-result perspective considering the high trading volumes of the June 29 and 30 bars, pointing to strength. Unless there is a sharp contraction below $16 with expanding volumes, ideally exceeding last week’s defining bars, the uptrend remains.
Technical charts courtesy of Trading View.
Disclaimer: The opinions expressed do not constitute investment advice. If you wish to make a purchase or investment we recommend that you always conduct your research.
If you found this article interesting, here you can find more Solana news.