Like most coins, fundamentals and price are diverging. In the case of XRP for example, widespread adoption, on chain decentralization efforts and increasing number of liquidity channel aren’t boosting prices.
Instead prices are stable and up roughly three percent in the last week as prices snap back to range mode in lower time frames.
Fundamentals
Brad Garlinghouse led Ripple and their counterparts from Ripple Labs, the creators of XRP—the on demand liquidity tool within the RTXP network are always on the news.
Often times, they find themselves on the defensive trying hard to cement their stands of why the RTXP network is more decentralized contrary to what critics says.
Indeed, since May 2017, when the then Ripple—representing both Ripple and Ripple Labs, announced their decentralization plan, they have been working hard on making it a reality.
As statistics show, the network is now more distributed and decentralized with Ripple, the company controlling just 48 percent—translating to 10 Validator nodes—of the RTXP’s Unique Node List. The other 11 are controlled by third parties.
With this minority status, it means Ripple cannot make or even implement changes affecting operations of the network without consultation as set out in their constitutions.
Besides, the lack of energy inefficient, incentive free proof of stake consensus algorithm means the network is more distributed since the cost of entry is low unlike in Proof of Work systems where pools literally monopolize transaction verifications locking out ordinaries.
Regardless of this important, SEC pleasing move, critics and crypto pundits are still on their case. They talk of XRP pre-mined coins and how founders’ XRP stash can still influence the cost of XRP in the open market and how financial institutions utilize Ripple products as xCurrent but not xRapid which would directly draw demand of XRP.
Ripple XRP Technical Price Analysis
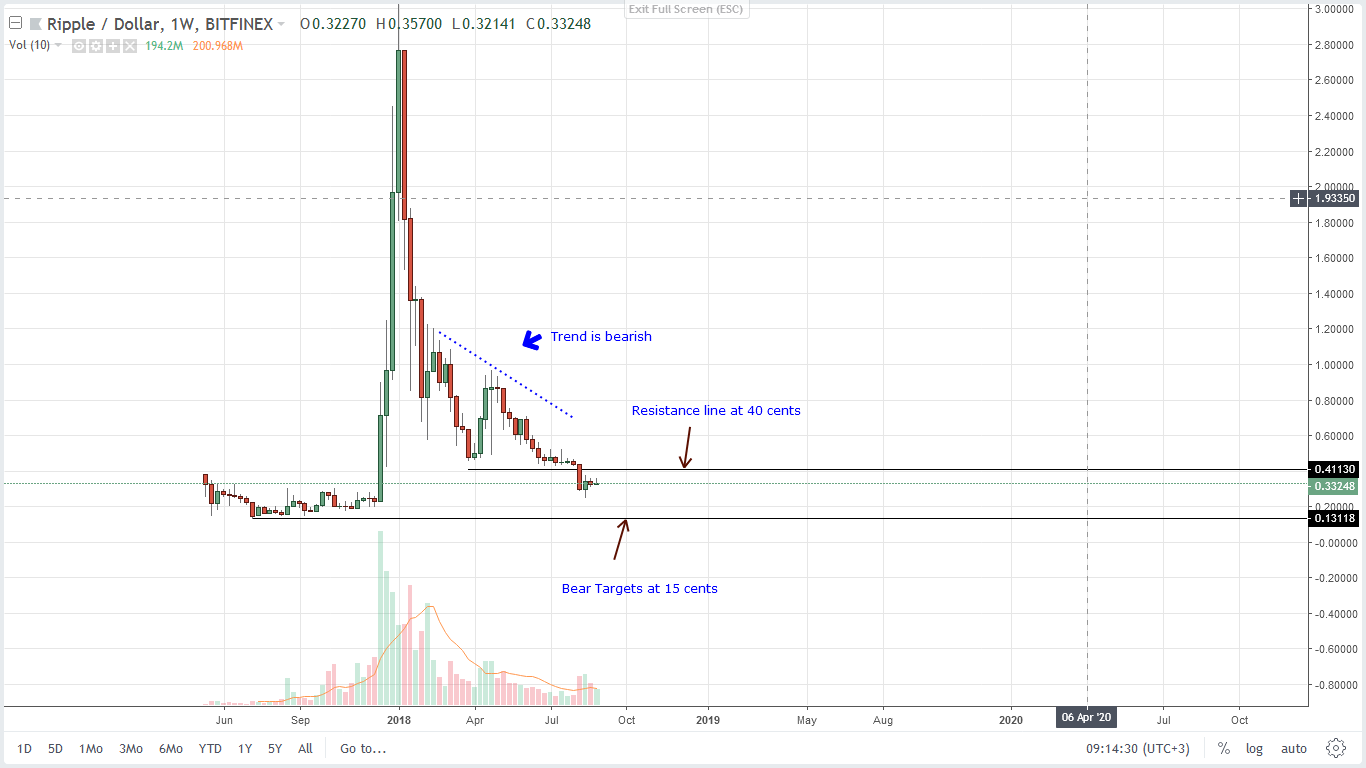
Weekly Chart – Ripple XRP – Technical Price Analysis
Here’s what you should know before moving forward:
Bitcoin dominance is at 54 percent. That is bad for altcoins including XRP. Historical prices indicate that Bitcoin dominance and altcoins prices have an inverse relationship. This means when BTC dominance is up, altcoin prices are down—and current prices show that.
On a weekly basis, XRP prices are up three percent. However, candlestick formations talk of a different narrative. XRP remains within a consolidation as they move below 40 cents and oscillate inside week ending Aug 12 high lows.
As long as it remains this way, we shall take a bearish stand with targets at 15 cents. The only move that cancels this bear projection is a strong thrust breaching 40 cents and closing above week ending Aug 12 highs at 55 cents.
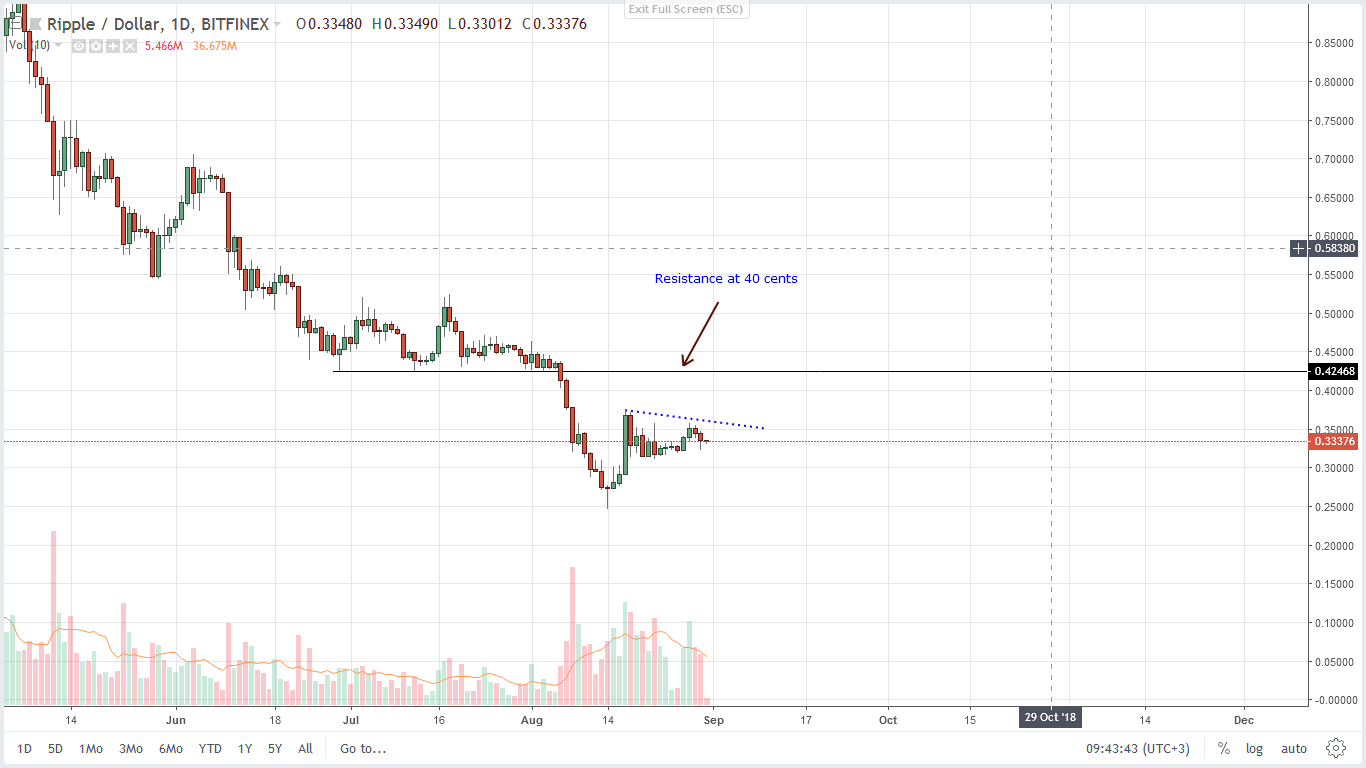
Daily Chart – Ripple XRP – Technical Price Analysis
In the daily chart, XRP prices are stuck within a range mode as in the weekly chart. But what stands out is that XRP bulls—despite being emphatic in the last week—didn’t break above 40 cents, our immediate highs.
If anything, this could be interpreted as bearish and probably the completion of the second stage of a typical bear break out pattern triggered by Aug 6 break below 40 cents. Furthermore, recent lower lows can as well be the early stages on the trend resumption phase.
Nonetheless, for assurance, our sell triggers should be at 30 cents meaning before then taking a neutral stand is reasonable. On the other hand, a move above 40 cents could lay the foundation for a break above 55 cents as mentioned before.
Disclaimer: This is not investment advice and views represent that of the author. Do your own research before making an investment decision.


