CoinMarketCap’s database recorded 59.08 million crypto assets at the close of August 2026, up from 23.45 million in September 2025. This 151.94 % increase over twelve months represents the highest documented supply expansion rate in the sector’s history.
The growth curve displays a pronounced inflection point from March 2026 onward, when the total surpassed 39 million, then accelerated toward 46 million in April, 52.8 million in June, and 59 million by September. This issuance rhythm has no parallel in prior cycles, not even during the Initial Coin Offering (ICO) boom of 2017‑2018.
The phenomenon does not stem from organic growth in utility or adoption, but from the convergence of three technical factors: the reduction of transaction costs on networks such as Solana, the proliferation of no‑code launchpads, and the full automation of token creation smart contracts. Pump.fun on Solana exemplifies this model: it allows the deployment of a new token for less than 0.02 SOL (approximately 3 USD at September 2026 exchange rates), without requiring upfront liquidity provision, via a bonding curve mechanism that algorithmically manages price formation and liquidity provisioning. Since its launch in January 2024 through June 2026, Pump.fun has generated over 18.67 million tokens, averaging more than 21,000 daily issuances.

The elimination of the entry barrier does not constitute, per se, a market problem; the problem lies in the absence of quality filters to compensate for the loss of scarcity. In traditional financial markets, listing costs and regulatory compliance act as natural selection mechanisms.
In the crypto ecosystem, that filter has been replaced by mere speculation and social‑media attention dynamics. Consequently, supply grows exponentially while demand for liquidity and investor attention remain fixed or grow at significantly lower rates. This asymmetry generates a structural imbalance affecting both price formation and capital allocation.
Survival Data: Early‑Stage Mortality as Statistical Norm
CoinGecko’s study of the approximately 20.2 million tokens listed on GeckoTerminal from mid‑2021 through end‑2025 yields a 53.2 % inactive token rate —no buy or sell orders in the thirty days preceding the analysis— by the close of that period. In 2025 alone, 11.6 million tokens ceased trading, representing 86.3 % of all token deaths during that five‑year span. The fourth quarter of 2025 concentrated 7.7 million disappearances, coinciding with the forced liquidation of $19 billion in leveraged positions on October 10, 2025, an event that dragged down virtually all low‑capitalisation assets.
Pump.fun on‑chain data provide an even more precise breakdown:
-
68.67 % of tokens generated on the platform (approximately 12.8 million) record their last transaction on the same day of creation.
-
80.37 % cease trading within the first 48 hours.
-
Only 4.55 % (roughly 850,000 tokens) maintain activity after 90 days.
The graduation rate —the percentage of tokens that exit the internal Pump.fun ecosystem and migrate to an external decentralised exchange such as Raydium— stands below 1‑2 %. This implies that out of every 100 launched tokens, fewer than 2 gain access to broader liquidity within the Solana ecosystem.
These metrics have a direct operational implication for any investor or market maker: the life expectancy of a newly issued token is measured in hours, not days or months. A 90‑day survival rate of 4.55 % means that, even applying active selection criteria, the probability that a randomly chosen token remains tradable after three months is below one in twenty. Note that the operational definition of “survival” is purely transactional —at least one trade during the period— and does not imply positive return or value preservation.
Decoupling Between Token Supply and Market Value Added
Exponential growth in the number of tokens has not translated into a more equitable distribution of market value; quite the opposite. Throughout most of 2026, Bitcoin has maintained a dominance above 60 % of total crypto market capitalisation, while Ethereum has captured another significant share. Together, along with the highest‑volume stablecoins, they concentrate over 75 % of global liquidity. The remaining 25 % is distributed among over 59 million tokens, implying extreme fragmentation in the long tail.
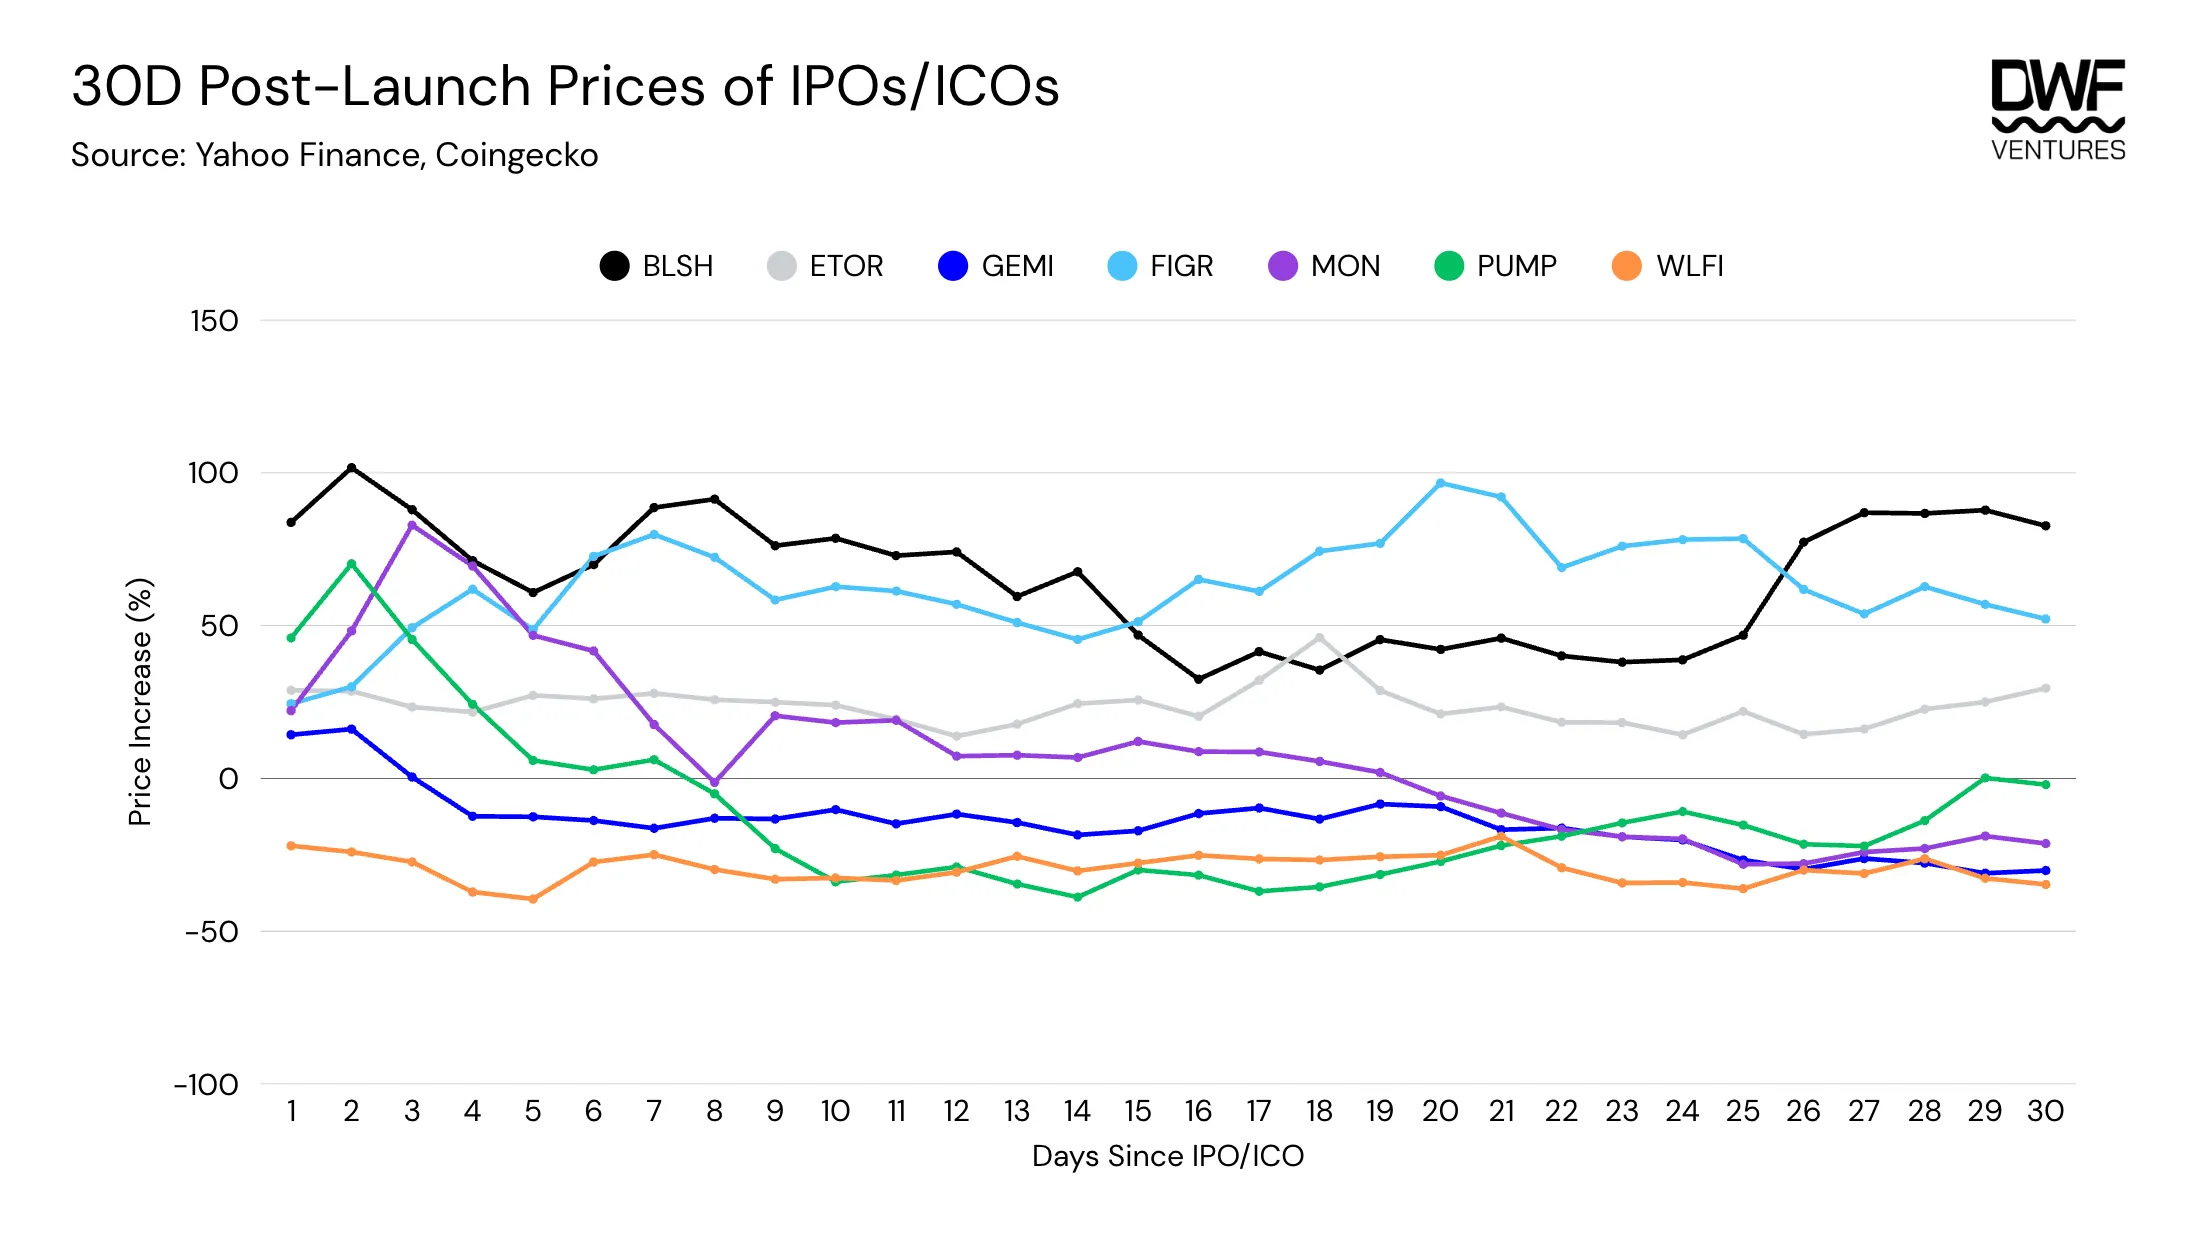
Research firm DWF Labs indicates that 80 % of new tokens trade below their Token Generation Event (TGE) price three months after launch, with average declines of 50‑70 % attributable to insufficient liquidity and predominantly speculative activity. This behaviour contrasts with established assets, which, although also volatile, possess deeper order books and a more diversified holder base.
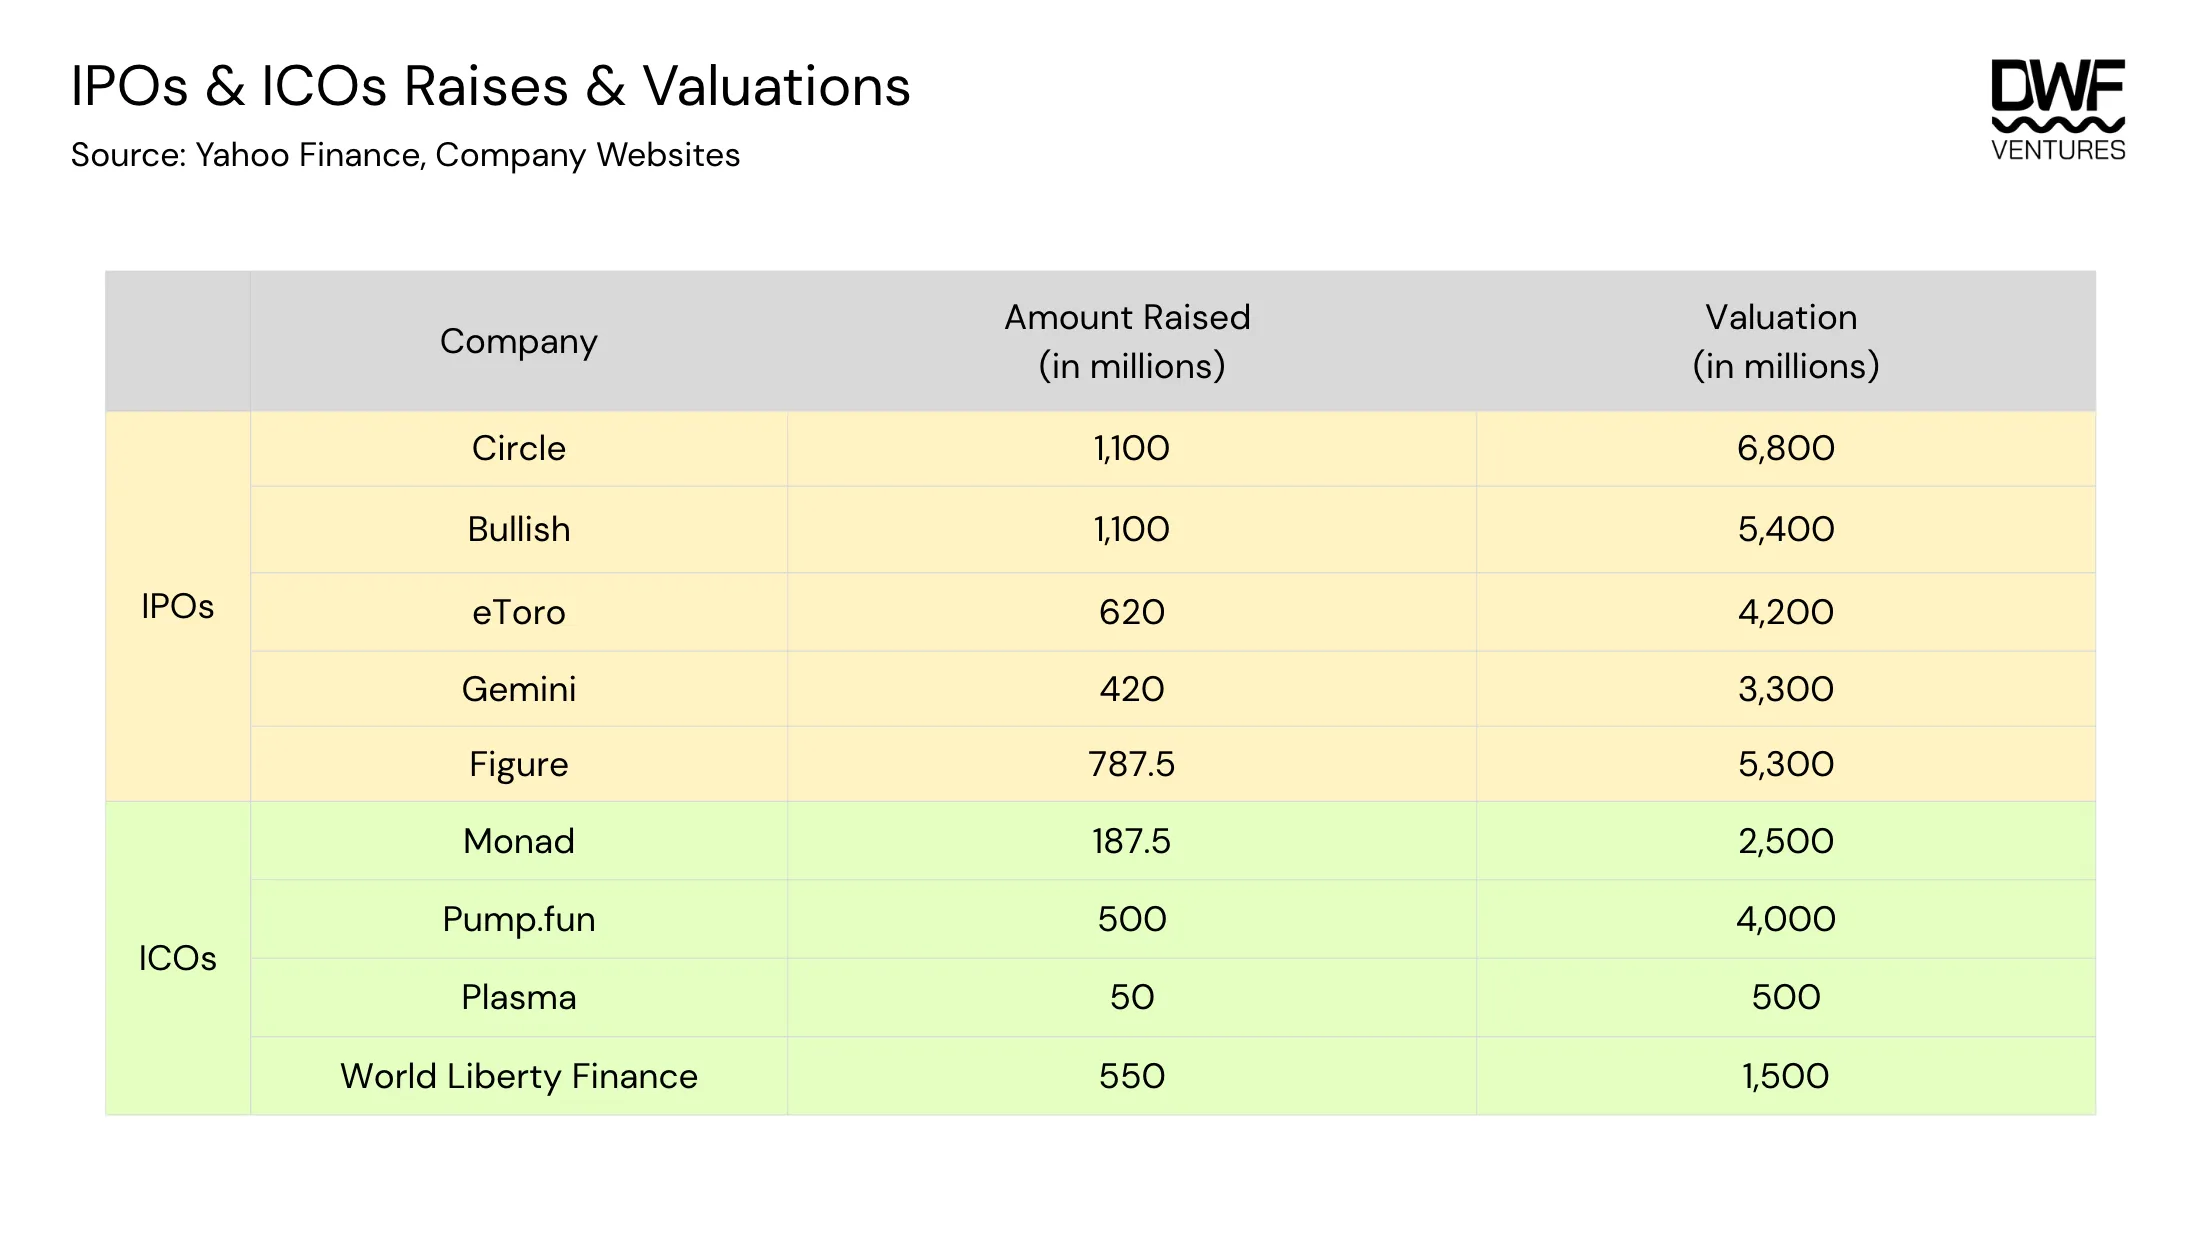
Pump.fun has generated over $1 billion in cumulative revenue as of September 2026, according to public Dune Analytics data. These revenues stem from creation fees and from each transaction within the bonding curve. The business model of these token factories does not depend on the subsequent survival or performance of the assets; value capture for the platform occurs at issuance and during the initial rotations. This misalignment of incentives —revenue secured for the launcher, full risk exposure for the buyer— constitutes a structural feature that explains the persistence of high supply despite the low average quality.
Market Absorption Capacity: Liquidity and Attention as Finite Resources
The question posed in the title —whether the market is ready for more tokens— requires disaggregation into two dimensions: available liquidity and information‑processing capacity of agents.
On the liquidity front, order‑book depth data from major centralised and decentralised exchanges show relative stagnation. Aggregate daily volume on centralised exchanges has remained in the $50‑80 billion range during the first half of 2026, with no significant growth relative to 2025.
This volume must be distributed across over 59 million assets, yielding a per‑token average liquidity that is minuscule —below $1,000 daily in most cases— insufficient to execute institutional‑sized orders without slippage exceeding 5 %.
On the informational dimension, the number of assets that a professional investor can evaluate with proper due diligence is limited. Research teams at crypto hedge funds typically cover between 50 and 200 active projects per quarter.
Even with automated analysis tools, scanning 59 million records is computationally feasible, but qualitative interpretation of tokenomics, team, roadmap, and development activity becomes impractical at scale. Over‑supply degrades signal amid noise, raising the opportunity cost of each investment decision.
Centralised exchanges have responded by raising their listing criteria. In March 2026, Binance explicitly prohibited market‑maker fee‑sharing arrangements and minimum return guarantees, mandating full disclosure of liquidity‑provider contracts and establishing a blacklist for violators.
This measure, combined with increasing rigour from project evaluation teams, has drastically reduced the probability that a token launched on a no‑code platform gains access to a top‑tier exchange’s liquidity. According to RootData, among new tokens launched in 2026 that have traded for more than 30 days, only 8 % show positive cumulative performance, and fewer than 10 tokens exceed 10 % gain from their opening price.
Implications for Different Ecosystem Participants
For institutional investors, token proliferation imposes a reallocation of resources toward pre‑filtering and automation of scrutiny. Firms managing passive or index funds are compelled to implement minimum market capitalisation and average daily volume criteria to exclude the majority of assets, reducing the investible universe to fewer than 2,000 tokens. Active funds, on the other hand, must devote an increasing fraction of their budget to early‑stage opportunity detection prior to TGE, which raises operational risk and exposure to unaudited projects.
For protocol developers and founding teams, the data’s lesson is unequivocal: token issuance does not constitute a success milestone, but the beginning of a sustainability challenge. The launch strategy must contemplate an initial circulating supply above 20 % of the total to facilitate price discovery, as recommended by the research team at 21Shares.
Likewise, it requires demonstrating product‑market fit (PMF) prior to TGE, through metrics of active users, fee revenues, or transaction volumes generated without speculative incentives. Issuances based solely on narrative or meme have demonstrated too short a lifespan to justify subsequent compliance costs and legal obligations.
For regulators, the volume of 59 million tokens raises questions about the applicability of existing frameworks. Most of these assets do not meet the issuance transparency, code audit, or risk disclosure requirements enforced in jurisdictions such as the European Union under the MiCA Regulation, whose effective application began in 2026.
The U.S. Securities and Exchange Commission (SEC) has proposed new rules for token offerings that could classify a significant portion of these issuances as unregistered securities, exposing issuers and launchpads to enforcement actions. However, direct supervisory capacity over millions of assets is limited, suggesting an approach based on infrastructure surveillance —launchpads, exchanges, wallets— rather than individual scrutiny of each token.
Quantitative Saturation, Qualitative Scarcity
The figure of 59.08 million crypto assets should not be read as an indicator of market maturity or diversification, but as a manifestation of failure in quality‑control mechanisms. Supply has grown without a corresponding increase in productive‑use demand, and liquidity has been diluted across thousands of projects without economic viability.
Survival data —with 80 % of tokens inactive at 48 hours— demonstrate that the expected value of a new token launched under the current model is negative for the marginal buyer. The exceptions are those tokens that manage to overcome initial filters and build a community with organic retention, but their number is statistically irrelevant against the mass of failed issuances.