No exchange failed in 2026. No stablecoin lost its peg. The absence is the most important fact of the year, and almost nobody frames it so.
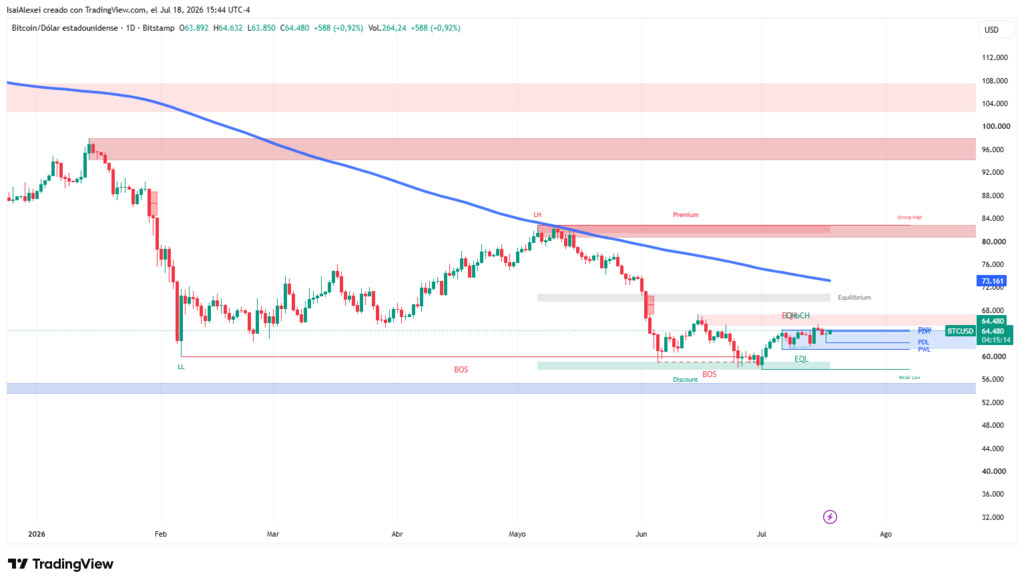
Bitcoin trades near $64,000 after touching 21-month lows below $58,000 in early July. The 52-week range runs from $57,700 to $126,200, per market data. The drawdown from the high reaches 54%. Calling a correction of such size “nothing” confuses recent chop with the full year.
The right question is not whether the market got trapped. It is why the decline arrived without a bankruptcy.
Every Prior Bear Market Came With a Credit Event
Mt. Gox in 2014. Then came Terra, Three Arrows, Celsius, and FTX in 2022. The sequence repeated: leverage, intermediary insolvency, forced liquidation, capitulation.
The central piece is missing in 2026. No custodian collapsed. No stablecoin issuer broke its backing. The price fell 54% without anything breaking inside. The 2022 decline had culprits with names. The 2026 decline has none.
The difference is not cosmetic. A credit bear market is a solvency crisis. Leveraged intermediaries sell because they must, not because they choose to. The selling runs violent and ends on its own: when the last forced seller liquidates, the pressure exhausts.
There sits the marker. The bottom of a credit bear market gets identified by the last liquidation. FTX failed in November 2022 and the price marked its low weeks later. The bankruptcy was the event and also the signal.
The 2026 market has no forced sellers to exhaust. Nothing broke, so nothing remains to clear. The absence of a crisis removes the indicator historically marking the floor.
The Allocator Replaced the Forced Seller
Spot Bitcoin ETFs drew more than 500,000 BTC in net inflows during 2024. The 2026 cumulative total marks roughly 120,000 BTC in net outflows, per data cited by Cointelegraph on July 17.
June recorded around $4.06 billion in net outflows, the worst month since the products launched, per CoinDesk. The streak reached eight consecutive weeks of outflows. The prior record stood at five.
The figures do not describe panic. They describe rebalancing. An allocator cutting exposure from 2% to 1% executes the order without urgency. It carries no margin. It faces no deadline. It sells because a committee approved a different weighting, and the story ends there.
The Allocator’s Mechanics Produce the Range
Citigroup research measured the relationship. Every $100 million in net ETF inflows correlates with roughly 53 basis points of same-day price movement. The cumulative effect reaches near 96 basis points over ten sessions. Sector analysis estimates ETF flows explain around 45% of weekly price moves.
When nearly half the price depends on allocation tickets, the price inherits the rhythm of allocation. Tickets arrive in blocks, on a quarterly calendar, without momentum. The output of such a function is not a trend. It is a range.
The other side of the book confirms the reading. Whales accumulated close to 270,000 BTC over two weeks in late June while the ETFs bled, per Crypto Economy. Two structurally different buyers, on different clocks, offset each other near the same price.
The result is not indecision. It is an ownership transfer at a fixed price. Bitcoin feels heavy at $70,000 and refuses to die at $60,000 because two different populations trade opposite directions at similar size.
Volatility Compression Rules Out a Crisis
Realized one-week volatility fell to roughly 17% on June 1, some 56% below the quarterly peak near 39%, per CryptoQuant. The recent-years average runs near 34%. During Black Thursday in 2020 it topped 90%.
A market in crisis does not compress volatility. It expands it. The compression indicates the opposite of a crisis: it indicates an orderly change of hands between populations with different horizons.
The Exit Is Not on the Chart
The Federal Reserve meets on July 28 and 29, under Kevin Warsh as chair since May. The rate has held all year at 3.50%-3.75%.
The asymmetry defines the problem. June’s dot plot lifted the end-2026 median to 3.8% from 3.4%. In total, nine of nineteen members project a hike during the year. One projects a cut. The market’s tail risk points up, not down.
For an allocator comparing Bitcoin against a risk-free asset above 3.5%, the arithmetic defines the whole decision. June CPI, released July 14, showed 3.5% headline and 2.6% core. The reading opens room without closing it.
An allocation bear market does not end with a liquidation. It ends when the allocator’s arithmetic changes. The condition depends on the Fed, not on crypto.
What to Watch Instead of the Price
The eight-week outflow streak ended in the week to July 10 with $197.4 million in net inflows, per Farside Investors. One week does not flip a regime.
Year-to-date outflows still sit near $5.4 billion. Citigroup cut its 12-month target to $82,000 on July 1, its second cut of the year. The bank took its 12-month inflow forecast to zero. The test consists of verifying whether inflows persist through the July 28-29 meeting.
The “summer of nothing” describes the feeling well and the mechanism badly. There is nothing to break because nothing broke.
The market is not trapped in a range with no exit. It is waiting on a figure outside its control. The exit exists, and it has a meeting date.