The crypto market shows an incipient shift in capital flows during May 2026. Several leading indicators point toward a potential rotation from Bitcoin into altcoins, but confirmation metrics still remain below the thresholds required to validate a broad-based altcoin season. The current movement reflects selective capital allocation based on fundamentals, not the indiscriminate speculative frenzy that defined previous cycles.
Bitcoin Dominance Begins to Lose Momentum
The Bitcoin Dominance Index (BTC.D) measures the percentage of total crypto market capitalization represented by Bitcoin. In mid-May, the indicator fluctuates between 58% and 61%, a range that historically limits the ability of altcoins to outperform BTC on a sustained basis.
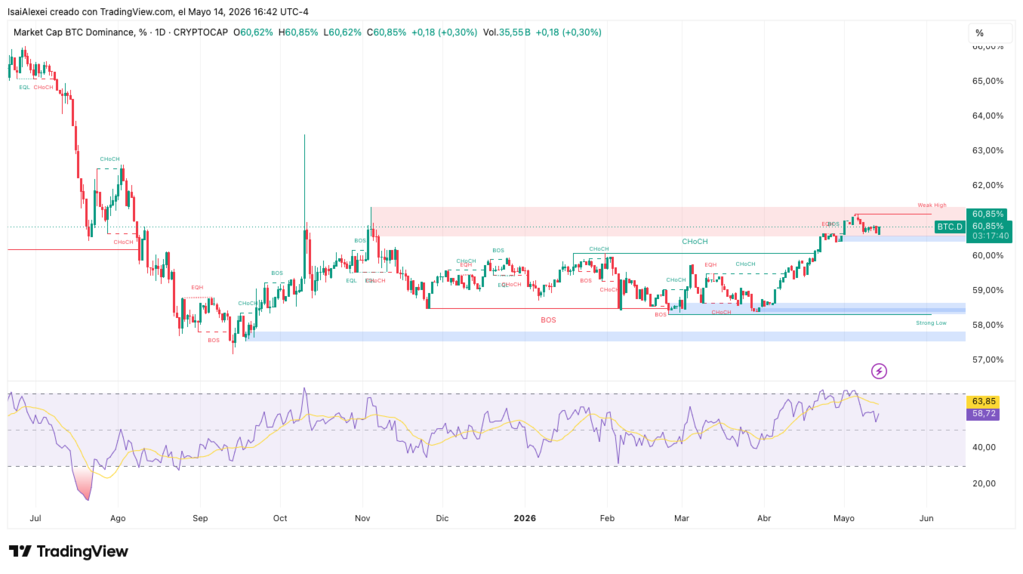
However, the daily chart now shows a bearish MACD crossover, a technical development that often signals exhaustion in bullish momentum. Analysts identify the 59.63% level as the most important support zone. A sustained breakdown below that threshold would likely become the first meaningful catalyst for a capital rotation into altcoins.
For now, BTC.D trends lower gradually, but the broader market structure remains intact. The weakness exists, yet confirmation does not.
Altcoin Season Index Rises Without Confirming Altseason
The Altcoin Season Index measures the percentage of the top 50 altcoins that outperform Bitcoin over a 90-day period. Current readings fluctuate between 35 and 48 points, still well below the 75-point threshold historically associated with a confirmed altseason.

The index has clearly recovered from the lows recorded during the first quarter of 2026, but the gap between current levels and confirmation territory remains significant. More importantly, the structure of this cycle differs substantially from prior speculative expansions. In previous altseasons, the indicator frequently surged above 95 points, reflecting broad market euphoria and widespread participation across virtually all sectors.
Today’s environment appears far more restrained and selective.
TOTAL2 Breaks a Long-Term Bearish Structure
The total market capitalization of altcoins excluding Bitcoin, commonly referred to as TOTAL2, surpasses $1.05 trillion in early May according to CoinMarketCap data.
Technically, the weekly chart breaks out of a descending wedge pattern that had persisted since the 2021 market peak. At the same time, the weekly MACD approaches a potential bullish crossover, a setup that previously preceded the prolonged altcoin rally of 2020.
Despite this favorable structure, one crucial detail stands out: the recovery remains concentrated in large-cap assets. Ethereum, Solana, and a handful of high-liquidity infrastructure projects absorb most of the inflows, while mid-cap and low-cap altcoins continue to lag behind.
That distinction matters because true altseasons typically require broad participation across the entire risk curve.
ETH/BTC Remains the Critical Weakness
The ETH/BTC ratio continues to serve as one of the most important indicators for evaluating the health of any potential altcoin cycle. Historically, Ethereum strength relative to Bitcoin acts as the primary gateway for capital rotation into the broader smart-contract ecosystem.
Throughout 2026, however, ETH/BTC maintains a persistent downtrend. Ethereum continues to lose relative value against Bitcoin, limiting enthusiasm across altcoin markets and suppressing speculative expansion.
Market history remains remarkably consistent on this point: broad altseasons rarely occur without a rising ETH/BTC ratio. Until Ethereum regains relative strength, capital flows into altcoins will likely remain concentrated in isolated narratives rather than expanding across the market as a whole.
Trading Volume Suggests Silent Accumulation
While prices have not yet produced explosive breakouts, volume data increasingly suggests that accumulation may already be underway beneath the surface.
On Binance, the share of altcoin trading volume rises from 31% at the beginning of the year to 49% in May, a substantial increase in relative participation. According to Kaiko data, the 30-day moving average of altcoin volume now exceeds the 365-day moving average, a signal often associated with expanding market engagement.
This divergence between rising volume and relatively muted price action suggests an early accumulation phase rather than speculative mania. In many historical cycles, capital repositioning began quietly before price appreciation accelerated visibly.
The market appears to be building exposure gradually instead of chasing momentum aggressively.
Institutional Capital Remains Concentrated in Bitcoin
The structure of the 2026 cycle differs significantly from previous crypto expansions because of the emergence of regulated institutional vehicles.
Spot Bitcoin ETFs now manage more than $130 billion in assets, and much of that capital remains confined inside regulated financial products rather than rotating freely into altcoins. This dynamic fundamentally alters the traditional liquidity cycle that previously fueled speculative expansions across smaller digital assets.

In earlier bull markets, profits generated in Bitcoin frequently flowed downstream into higher-risk altcoins. Today, institutional capital behaves differently. Pension funds, asset managers, and regulated investors often lack both the mandate and the flexibility to move beyond Bitcoin exposure.
At the same time, Bitcoin’s futures premium — a proxy for speculative demand — collapses from nearly 30% at the end of 2025 to near zero in May 2026. This decline points toward a market environment driven less by leverage and more by cautious positioning.
Structural Risks Continue to Limit Rotation
Several major factors continue to work against a broad-based altseason.
First, if BTC.D rebounds above 66%, the window for altcoin outperformance would likely close temporarily. Second, macroeconomic uncertainty continues to weigh on risk appetite. Geopolitical tensions between the United States and Iran, combined with persistent inflationary pressure, keep many investors concentrated in Bitcoin as the perceived reserve asset of the crypto ecosystem.
Additionally, the industry now faces a structural saturation problem. More than 51 million tokens currently circulate across the market. That extreme fragmentation disperses liquidity and makes generalized exponential rallies increasingly difficult.
Recent research reports from Gate.com describe the current environment as “slow flows into quality projects”, not a return to the euphoric conditions of 2021.
The Metrics That Matter Most
The current transition still lacks definitive confirmation. Most key indicators remain neutral, partially constructive, or insufficient for declaring the start of a true altseason.
The strongest signals for a confirmed regime shift would include:
- BTC.D breaking decisively below 59.63%
- A sustained bullish reversal in ETH/BTC
- Altcoin Season Index moving above 75
- Broader participation from mid-cap and low-cap assets
- Accelerating volume outside Bitcoin and Ethereum
Until those conditions align simultaneously, the data points toward an early, selective, and relatively cautious rotation, not a confirmed altcoin season.
For now, the market appears to favor liquidity, infrastructure, revenue generation, and real utility over the indiscriminate speculation that dominated previous cycles.