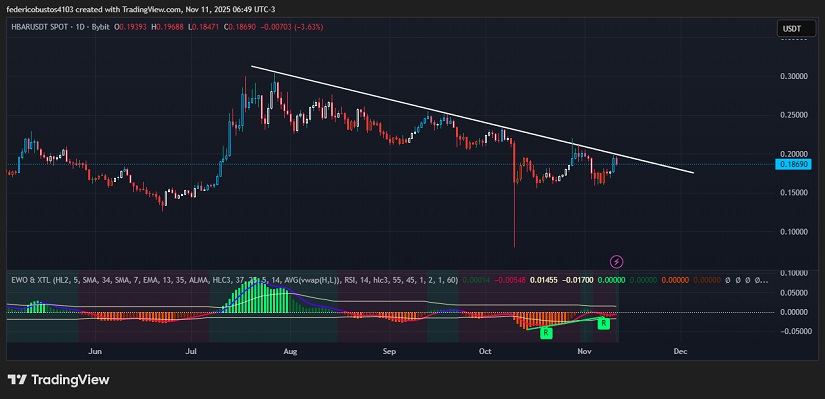
- The trend remains clearly bearish, with the price still respecting the descending trendline that began on July 27 after an accumulated drop of nearly 48%.
- Technical indicators are showing initial signs of recovery, but without solid confirmation of a trend reversal yet.
- Key zone: a breakout with a daily candle above the bearish trendline would open the path toward $0.25; a loss of $0.16 would enable a move down to $0.11–$0.12.
Fundamental Momentum: Institutional Adoption and Supportive Macro Tailwinds
HBAR has drawn attention with relevant developments in its ecosystem: there has been a strong increase in on-chain activity and institutional inflows, reinforcing its narrative of enterprise adoption. Additionally, integration with data analytics services and a potential ETF approval linked to HBAR stand among the positive catalysts.
In the broader crypto market, a “risk-on” sentiment has emerged following signals that the prolonged partial U.S. government shutdown could be nearing an end. Both the stock market and cryptocurrencies reacted to the upside after legislative progress to reopen the federal government. This matters because when macro uncertainty decreases, risk assets such as cryptocurrencies tend to benefit. For HBAR, this suggests that if it breaks out technically, it may capitalize on this broader market momentum.
From a fundamental standpoint, conditions remain partially positive for HBAR: institutional adoption and network infrastructure improvements are underway, and the macro-crypto environment has turned more constructive. However, actual demand has not yet translated into a clear upward trend.
Technical Analysis of $HBAR
The daily chart shows HBAR still confined within a well-defined bearish trend since late July, with multiple rejections at the descending trendline. It is currently trading at $0.18690 (-3.63% 24h), once again approaching this dynamic resistance level. For a valid reversal, a daily candle close above the trendline will be crucial, ideally supported by growing volume.
Recent volume remains below average, showing a lack of conviction from buyers. For a credible breakout, a significant increase in volume is required; otherwise, it risks being another false breakout. The EWO shows a tentative recovery in bullish momentum, with green bars emerging—an early sign that bearish pressure is weakening. However, it remains in a weak area, so the signal is constructive but unconfirmed.
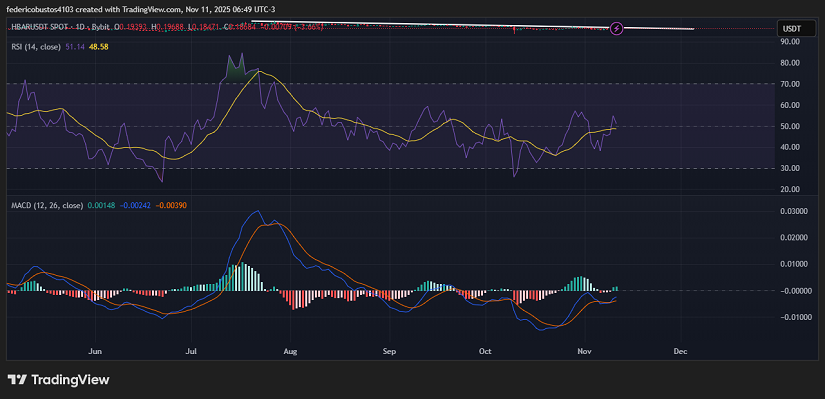
The RSI is around 51, showing neutrality. The asset has exited oversold territory but still lacks the strength to confirm bullish momentum. In fact, its slope is negative. A break above the 60 level would suggest accelerating bullish momentum and early breakout confirmation.
The MACD shows a recent bullish cross, but the histogram remains modest. This is an early signal of a potential trend shift, but it still requires volume confirmation to validate the move.
Conclusion and Scenarios
HBAR is at a critical inflection zone. A daily close above the bearish trendline, supported by rising volume, would trigger a structural shift with targets at $0.22 and then $0.25.
If, instead, the dynamic resistance prevails and the price falls below $0.16, it would confirm a continuation of the bearish cycle, with a likely extension toward $0.11–$0.12.
Technical charts courtesy of TradingView.
Disclaimer: The opinions expressed do not constitute investment advice. If you are looking to make a purchase or investment, we recommend that you always do your research.
If you found this article interesting, here you can find more ALTCOINS News.