
TL;DR
- Extreme leverage accelerates crypto liquidations as derivatives usage grows across increasingly fragile markets.
- “Early Black Friday” crash triggered massive hourly liquidations, sharply reducing Bitcoin open interest.
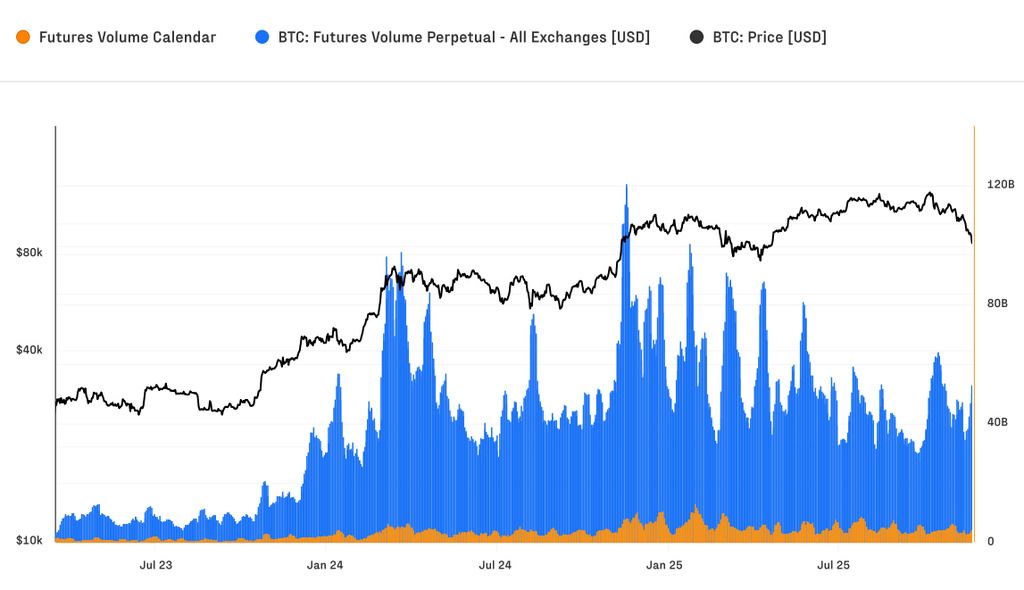
- Futures activity hits records while spot volumes rise, showing disciplined accumulation during volatility.
The crypto market is moving through a phase of extreme leverage, driving liquidation levels far beyond those seen in previous cycles. Fresh data from Glassnode and Fasanara shows a rapid rise in forced position closures, revealing a structure that operates with greater sophistication but also greater fragility.
Liquidations Accelerate as Traders Rely More on Derivatives
A comparison between cycles shows a sharp increase in daily figures. In the prior cycle, average liquidations hovered near $28 million for long positions and $15 million for shorts. In the current cycle, these amounts rise to $68 million in longs and $45 million in shorts.
Crypto Economy analysts point to wider use of aggressive derivative strategies, driven by institutional and advanced traders seeking returns through high leverage. The practice creates quick profit potential, though it also introduces fragility when prices move sharply.
“Early Black Friday” Marked a Turning Point
October 10 stands out as a key moment in the current cycle. During the abrupt drop referred to as “Early Black Friday,” Bitcoin fell from $121,000 to $102,000 within minutes. The move triggered a cascade of liquidations exceeding $640 million per hour in long positions.
Open interest fell 22% in less than 12 hours, sliding from $49.5 billion to $38.8 billion. The event ranks among the most violent deleveraging episodes in Bitcoin’s history.
Open Interest Reaches New All-Time Highs
Despite the volatility, futures markets continue to expand. Open interest has climbed to a record $67.9 billion, accompanied by heavy trading activity.
In mid-October, daily futures volume reached $68.9 billion, with perpetual contracts accounting for more than 90% of the action. The trend underscores a market that increasingly prefers derivatives to gain exposure without owning spot BTC.
Spot Market Shows a Different Pattern From Prior Cycles
The Bitcoin spot market has experienced an equally sharp shift. Current daily volumes range between $8 billion and $22 billion, roughly double the previous cycle’s norm.
During the October sell-off, hourly spot volume hit $7.3 billion, more than triple recent highs. Instead of retreating, buyers used the drop to accumulate, suggesting a market that now reacts with more discipline and less panic selling.
Spot ETFs Reshape the Price-Discovery Process
The arrival of U.S. Bitcoin spot ETFs in early 2024 changed how price discovery occurs. Glassnode notes that price setting has migrated toward spot markets, while leverage has concentrated in futures.
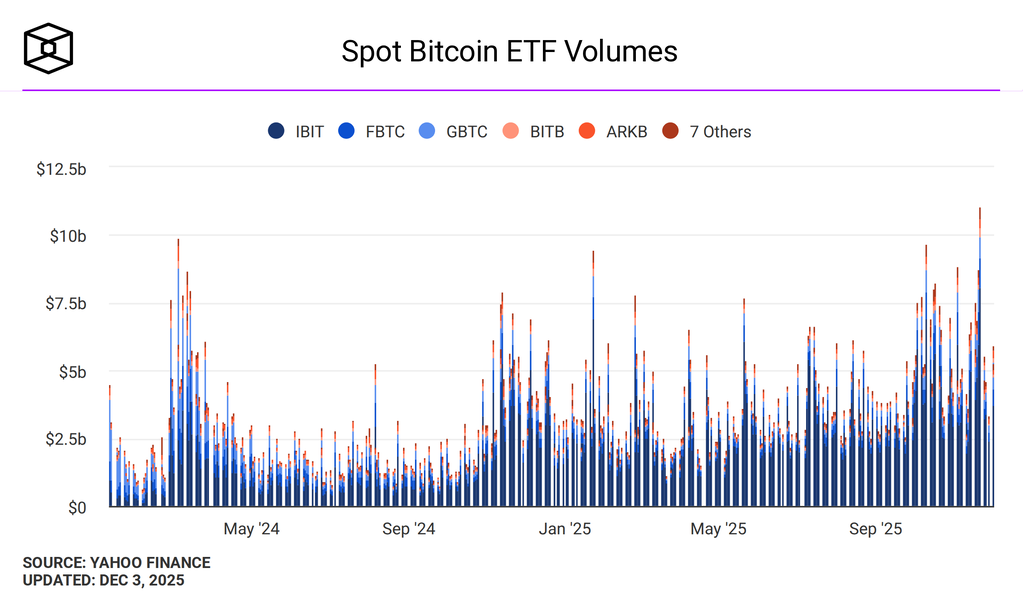
Bitcoin’s market share reflects the shift: dominance has climbed from 38.7% at the end of 2022 to 58.3% today. Capital inflows into Bitcoin range from $40 billion to $190 billion per month, lifting its realized market cap to $1.1 trillion.
Bitcoin Strengthens Its Role as a Global Settlement Network
Another key finding highlights Bitcoin’s growing function as financial infrastructure. Over the past 90 days, the network has processed $6.9 trillion in transfers—surpassing the combined throughput of Visa and Mastercard over the same period.
The trend positions Bitcoin as more than a speculative asset. It now operates as a global settlement system for high-value transfers.