It has been a disastrous one week for Ethereum and the crypto market. No sooner were there talk of Ethereum sky rocketing to $365 and clearing June 2019 highs than did reality set in and prices crumbled to $180 before recovering.
Even so, normalcy has resumed and price action is calm to say the least. However, despite the whipsaws and cratering, Ethereum’s fundamentals are strong.
Ethereum is ahead because of DeFi
Ethereum advantage not only stems from its first mover advantage, deep liquidity, and developer activity but from DeFi dapps.
Sometimes back in February, DeFi apps held more than $1 billion in ETH which acted as collateral for borrowers. Although CDPs remained high, at 150% because of the coin’s volatility, more people know more about Ethereum than all other competing platforms.
DeFi is why Ethereum leads in Adoption
DeFi as an innovative solution where lenders can park their stash when markets are trending higher, earning rewards through capital gains and above market lending rates, is an option for aggressive investors turned off by low savings rates offered by banks.
This knowledge alone is a mark of adoption and as such, compared to Tron and EOS, networks that are popular for gaming and gambling, Ethereum, although struggling with scalability, is eons ahead of competitors, leading the adoption wave.
ETH/USD Price Analysis
Price wise, its native currency is also the most valuable only after Bitcoin (BTC). In the face of unrelenting bears and uncertainty, ETH has stabilized in the last trading day.
Even so, the coin is trending cautiously above the psychological $200 level and is down 10% week-to-date. Good news is that the coin is encouragingly up 50% in the last year.
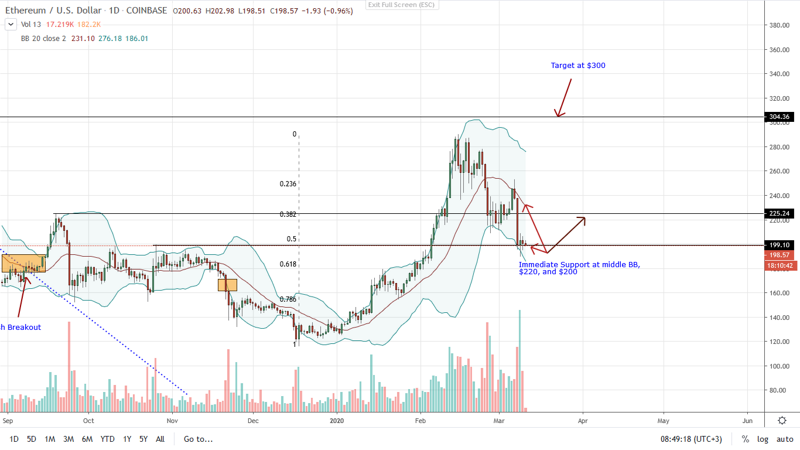
Technical candlestick arrangements suggest bears in the short-term but bulls in the long term. To fully grasp this, a top-down analysis reveals that ETH is only down 50% after retesting $300, another key resistance level.
Currently, prices are trending in between the 38.2% and the 50% Fibonacci retracement levels which are typical buy zones. Notably, Mar 9 bull bar was not only bullish but the participation level behind it was high. Interestingly, Mar 9 trading volumes were higher than Mar 8 conspicuous bear bar.
From this, and more so if today’s bar ends up bullish, traders can buy the dips and prepare for a correction higher. For the risk-averse, ideal buy trigger is above Mar 8 bar at around $225-$230.
Once bulls reverse deep losses of Mar 8 and the move up is accompanied by high trading volumes, odds are ETH will rally back to $300 in a trend continuation pattern.
Chart courtesy of Trading View—Coinbase
Disclaimer: Views and opinions expressed are those of the author and is not investment advice. Trading of any form involves risk. Do your research.