
- Ethereum has faced multiple rejections at its resistance level over the past two weeks, intensifying selling pressure and pushing it towards its support zone in recent hours.
- ETH is in an oversold zone according to the RSI, indicating high bearish pressure with the possibility of a technical rebound. The MACD continues to show strong negative momentum, suggesting that the downtrend is not yet over.
- Implementations like Pectra could increase demand for ETH and impact its price, making it a key factor to monitor in determining the market’s next direction.
New Updates and Their Impact on ETH
Over the past 15 days, Ethereum has been at the center of significant events that could impact its demand and, consequently, its price. The Ethereum Foundation has allocated $120 million to two DeFi protocols, strengthening the decentralized financial ecosystem and potentially attracting more users and investors to the network.
Additionally, the recent implementation of “Pectra” on the Holesky testnet, one of the two testnets of the network co-founded by Vitalik Buterin, is expected to improve the network’s efficiency and scalability, key aspects for its mass adoption. It is also set to be deployed on the Sepolia testnet on March 5, allowing its performance to be evaluated before activation on the mainnet (scheduled for April 8, 2025, according to Ethereum developers).
Meanwhile, the New York Stock Exchange (NYSE) has submitted a request to the U.S. regulator (SEC) on behalf of Grayscale to obtain approval for staking in its spot Ethereum ETFs. This has raised expectations of significant institutional capital inflows. These developments, combined, could increase ETH demand in the short to medium term.
However, in recent days, uncertainty surrounding the FED’s monetary policy and the negative impact of the Bybit hack have created a bearish trend in the crypto market.
ETH Technical Analysis
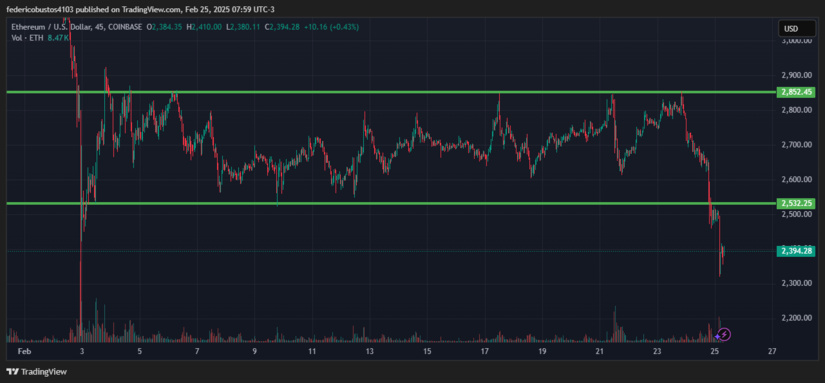
The 45-minute Ethereum chart shows clear consolidation within a defined range, with key resistance at $2,852 and support at $2,532. Last week, the price experienced multiple rejections at the resistance zone, indicating that sellers strongly defended that level. The lack of sustained buying pressure caused the price to fall back within the range, even testing and breaking the key support, currently hovering around $2,394.28.
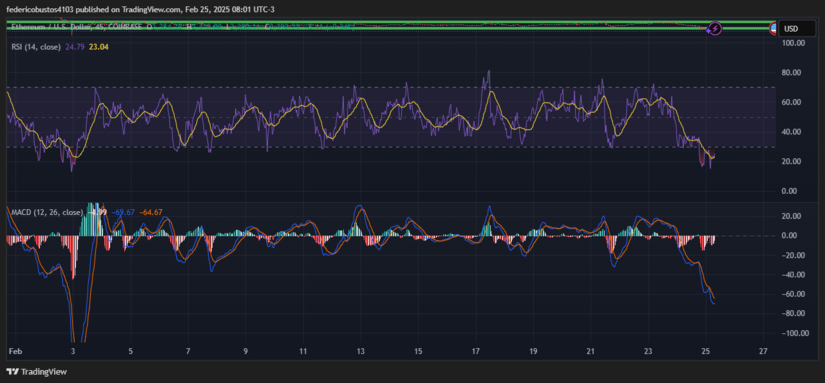
The RSI is in the oversold zone, around 24 points, indicating strong bearish pressure in the market. This level suggests that ETH may be in a phase of downside exhaustion, but unless the RSI recovers clearly above 30 points, the downtrend will continue to dominate.
On the other hand, the MACD reflects a clear loss of bullish momentum, with the fast line at -69.67 and the slow line at -64.67, maintaining a negative slope. The widening of both lines reinforces the bearish signal, suggesting that the correction could extend further before a potential rebound.
Conclusion and Scenarios
ETH is currently at a critical moment, if it fails to recover quickly, selling pressure could intensify, pushing the price to test the next support level at $2,100. Moreover, the lack of buying volume and the bearish signals from technical indicators increase the risk of further downward continuation.
Technical charts courtesy of TradingView.
Disclaimer: The opinions expressed do not constitute investment advice. If you are looking to make a purchase or investment, we recommend that you always do your research.
If you found this article interesting, here you can find more Ethereum News.