TL;DR
- @ETH_Daily questions whether to buy or sell ETH after a ~20% drop and approach toward recent lows.
- It highlights the current price is 30-40% below the average cost basis of major institutional holders.
- Technical analysis points to more volatility and potential tests of support near the $2,000-$2,100 zone.
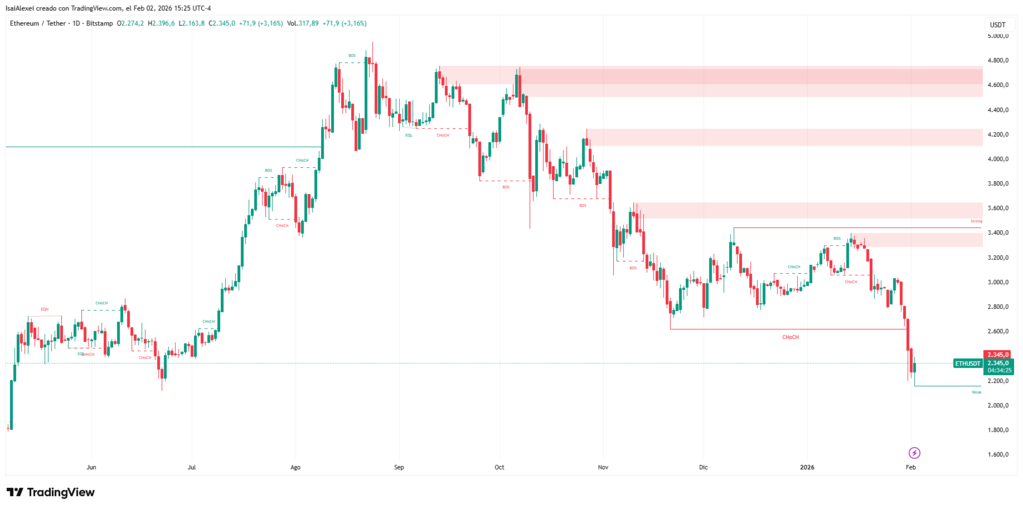
The question @ETH_Daily posed on February 2nd cuts through the noise: “Should you buy or sell ETH right now?” The account shared a clean daily chart showing Ethereum closing at $2,286.27 after opening at $2,270.24, with a high of $2,324.73 and a low of $2,241.58.
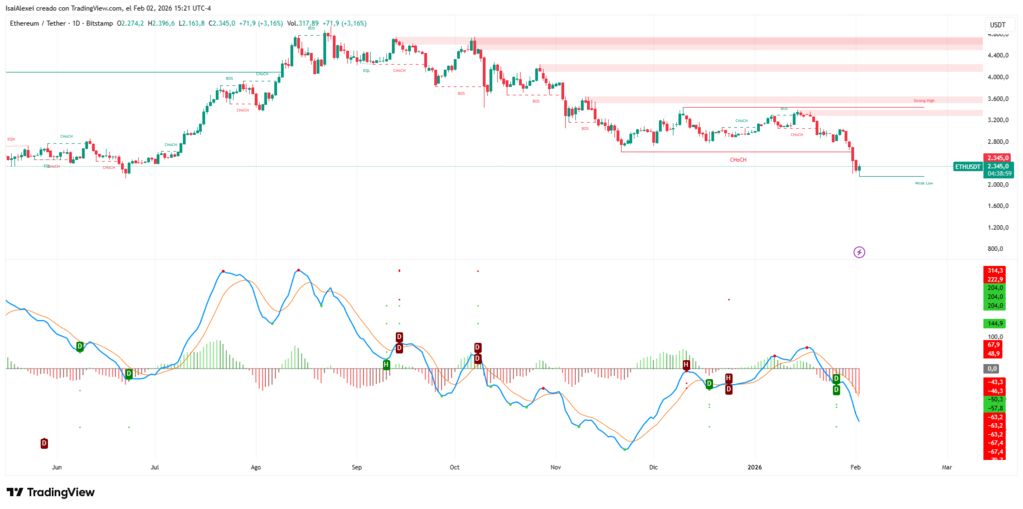
The price action reveals a sharp decline over recent sessions, breaking previous support levels and approaching recent lows, with a clear downtrend from levels above $4,000 months earlier.
The post acknowledges the emotional turbulence investors face—anxiety, fear, panic, even anger—following a roughly 20% drop in the past week. However, it urges against impulsive selling. The message emphasizes a concrete fact: current entry points sit 30-40% cheaper than positions held by major institutional players.
Bitmine holds $9.6 billion in ETH at an average cost near $4,000, while Sharplink accumulated over $2 billion around $3,500. The post closes with standard disclaimer language about conducting personal research rather than treating it as financial advice.
@ETH_Daily maintains an educational approach focused on Ethereum, Layer 2 protocols, and long-term conviction despite market swings. In replies and quoted tweets following the original post, the account reinforced a “believe” narrative, sharing data on stablecoin outflows totaling $587 million in 24 hours and memes about resilience. The responses to community questions remained measured: corrections form part of the investment process.
Technical ETH Points Toward Prolonged Volatility
Ethereum has entered a typical post-euphoria capitulation phase, dragged down by Bitcoin’s weakness and massive liquidations exceeding $2.5 billion. The daily chart confirms breaks of key support zones around $2,500–$2,550, now testing the $2,200–$2,300 range as a critical area. Sustained loss of $2,200 could trigger analyst targets between $1,800–$2,000, or even lower sweeps before establishing a floor.
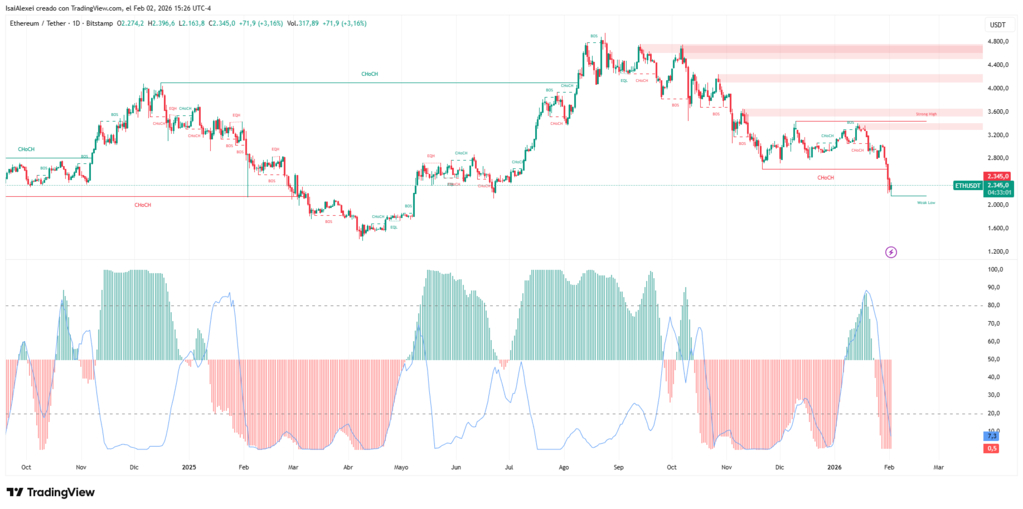
The RSI hovers near oversold territory at 34–40, suggesting potential divergence if price makes new lows while the indicator forms higher lows. Volume spiked during selloffs but declined on rebounds, indicating weak buying conviction. Moving averages remain overhead barriers, with the 200-day sitting around $3,500–$3,800.
Yet @ETH_Daily’s implicit message aligns with institutional holders accumulating during severe dips: the current decline offers historically attractive entries compared to $3,500–$4,000 averages. Previous cycles saw ETH endure 50-70% intra-cycle corrections before resuming rallies. With on-chain usage, Layer 2 growth, and staking fundamentals intact, many view the current action as a shakeout of weak hands before recovery—potentially toward $3,000+ if stabilization occurs and Bitcoin stops bleeding.
The coming weeks will likely bring more volatility and possible tests near $2,000–$2,100 if panic persists. But if a base forms here with declining volume and technical divergences, a bounce could materialize. The tweet frames a clear choice: sell into fear or buy the opportunity institutions already took at much higher prices? Patience and conviction appear to be @ETH_Daily’s mantra during the drawdown.
Van de Poppe Draws Gold Parallel: ETH/BTC Could Rally 300% After Current Drawdown
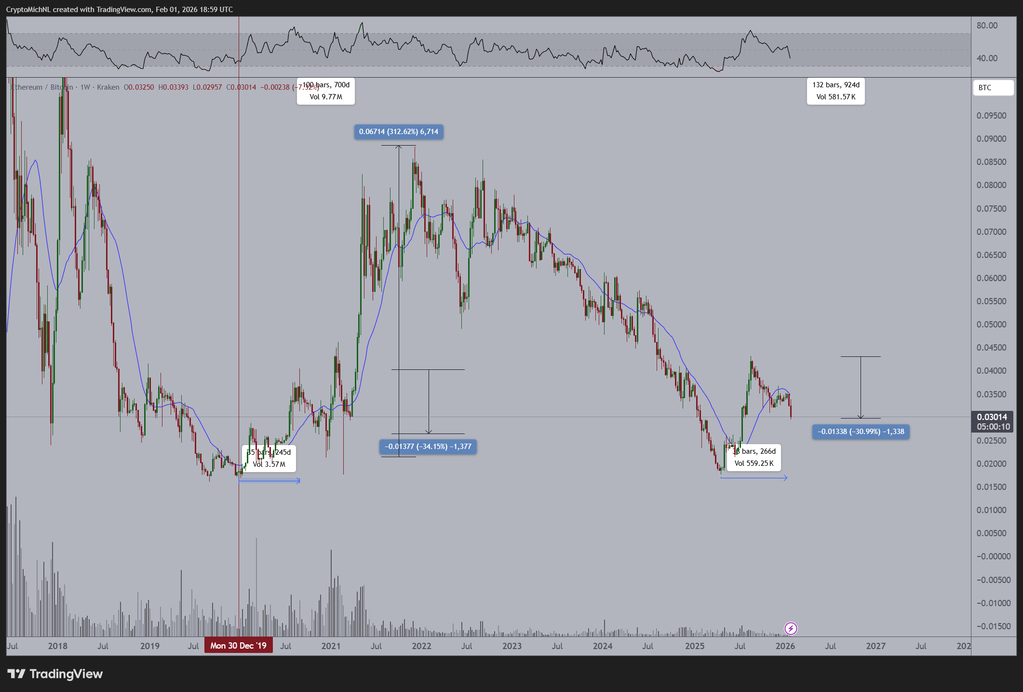
Michaël van de Poppe posted a weekly chart comparing the ETH/BTC ratio to historical gold behavior. The graph from Kraken spans 2018 to 2026, showing Ethereum against Bitcoin in a prolonged downtrend from peaks near 0.085–0.09 in 2021–2022, falling to current levels around 0.03014. The chart marks a -30.99% decline over the past 266 days and previous drops of -34.15% during earlier periods. Horizontal lines highlight key zones at 0.04 and 0.03, with a blue arrow indicating the present compression phase.
Van de Poppe’s core message draws a direct comparison
The last time gold topped, the following occurred: ETH bottomed nine months earlier and ETH crashed 30-40%. The current cycle mirrors the pattern: ETH bottomed nine months before gold’s recent peak and has already dropped 31%. According to the analyst, what followed historically was a 300%+ rise for Ethereum against Bitcoin and a broader crypto bull market.
He uses the fractal to suggest that gold’s recent peak near $5,500–$5,600 in late January 2026 could mark a turning point similar to the previous cycle, likely referencing 2019–2021 when gold topped and ETH/BTC exploded during altseason. He views the current drawdown of ETH versus BTC at roughly 31%, near the 0.030 level, as parallel to the historical 30–40% crash, positioning the ratio in a zone for potential strong reversal once gold corrects and risk appetite returns.
Support Levels Define Near-Term Trajectory
Van de Poppe has repeatedly marked the 0.029–0.030 support as crucial across multiple posts in January and February 2026. He emphasizes holding the level is “enormously important” for a new upward leg. His recent analysis notes compression and bounces at the 21-day moving average, with potential breakout if momentum returns. On February 2nd, he pointed out that when Bitcoin climbs back to $88,000+, Ethereum follows, and without new all-time highs in gold or silver soon, the “floodgates” open for crypto.
The short-term outlook carries high volatility and downside risk in ETH/BTC if Bitcoin remains weak. Tests of 0.026–0.028 remain possible if capitulation continues. The ratio has already broken previous supports, and Bitcoin dominance near 57–59% pressures altcoins.
However, the medium-term picture shifts if the fractal holds. Van de Poppe anticipates massive outperformance of ETH versus BTC—potentially a 300%+ rise in the ratio—implying Ethereum recovering toward 0.09–0.12 or higher during the bull leg.
The setup aligns with post-shakeout rotation, especially if ETH/USD defends $2,200 and Bitcoin stabilizes. Fundamentals including staking, Layer 2 adoption, and real-world assets support the thesis, though execution depends on Bitcoin not bleeding further.
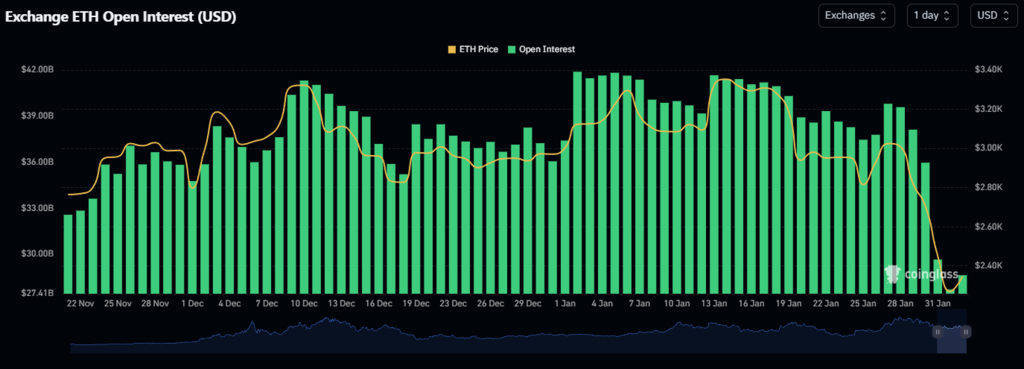
From an Open Interest (OI) analysis perspective, Ethereum is showing a gradual increase in open interest across derivatives markets, particularly in perpetual futures. This behavior suggests a rebuilding of positions by professional and institutional traders, following the strong capital rotation toward Bitcoin seen in previous months. Unlike purely speculative spikes, ETH’s OI is rising in a controlled manner, which often precedes sustainable directional moves once price exits key consolidation zones.