
Ethereum is wavy but encouragingly stable at press time. Because of a global financial crisis, investors and traders are unwilling to loosen their purse strings and splash on ETH. From the daily chart, ETHUSDT prices are range bound. It is despite earlier gains. ETH is within a narrow, tight, and dull $1.5k zone with caps at $1.4k and $1.25k.
Technically, sellers are in control and the sentiment is amid the general apprehension across the board that the markets could be headed for more doldrums in the months ahead. Still, Ethereum is propped by solid fundamental, protocol-level induced changes to support optimistic traders in the medium to long term.
Ethereum State of Affairs
Even though network activity in competing networks has dropped to record levels, Ethereum’s on-chain activity is, by far, decent. The 11 month bear run has shredded user confidence and with tanking asset prices, users, most of whom would ordinarily plug in, are staying away.
To illustrate this phenomenon, Gas fees are at record lows and have been flat-lining in the past few weeks, more in sync with the state of prices. Even so, network utilization is over 95 percent and blocks are being filled even after the shift to a staking platform.
Ethereum developers are now striving for perfection and better scalability. The shift to a staking system would set the ball rolling for on-chain changes to initiate a highly performant blockchain network.
Ethereum Price Analysis
Presently, ETH is down four percent week-to-date but steady in the last trading day.
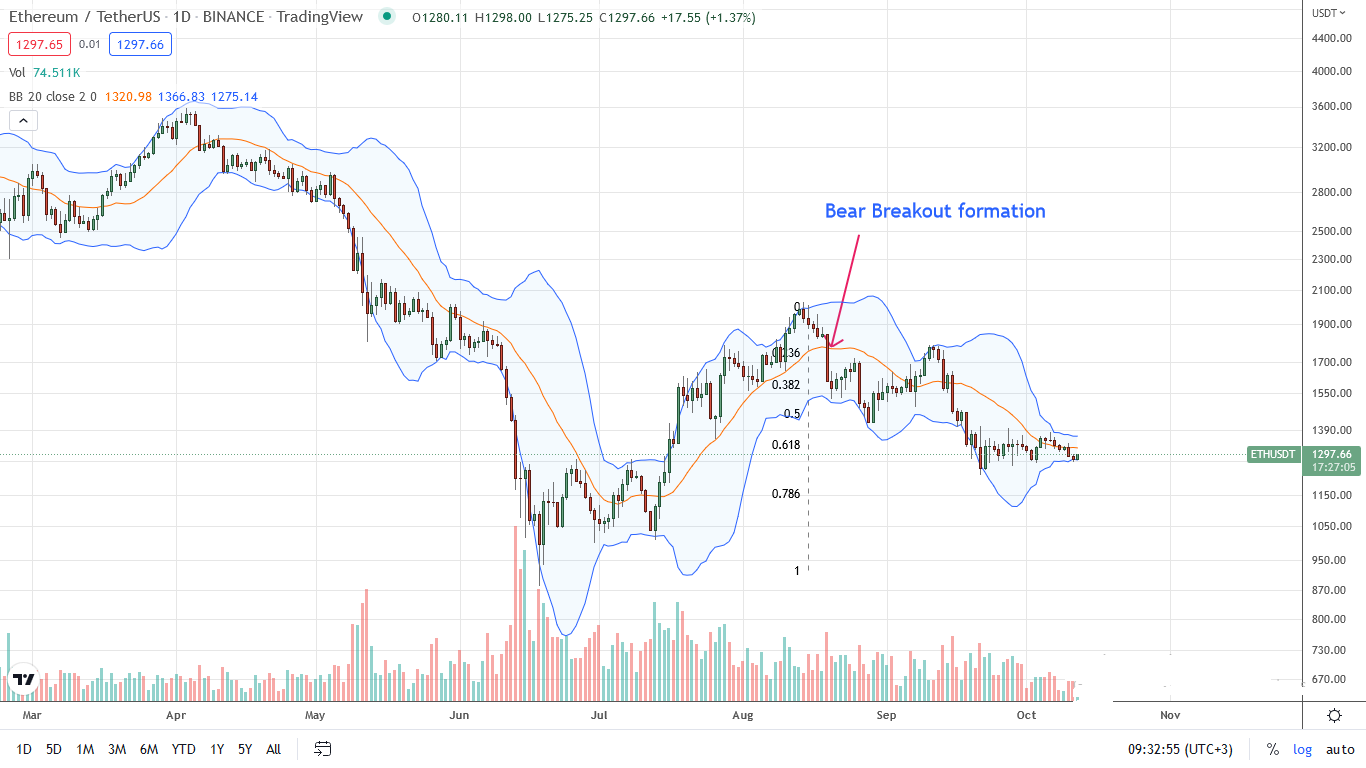
Even though traders were optimistic following the merge, ETH is, by-and large, down, retesting key support lines. From the daily chart, the $1.2 and $1.25k zone is a critical area. If prices drop below this zone, ETH may fall to multi-week levels in a bear trend continuation formation.
Presently, Ethereum prices are within a broader wedge with clear support at $1.2k, on the lower end. This flashes with the 78.6 percent Fibonacci retracement level of the June to August 2022 trade range. If sellers force ETH below $1.2k, prices could easily drop to $1.1k.
Accordingly, in light of the prevailing trend, traders can unload ETH as long as prices are below $1.4k, targeting $1.1k.
Technical charts courtesy of Trading View
Disclaimer: Opinions expressed are not investment advice. Do your research.
If you found this article interesting, here you can find more Ethereum News.