
Ethereum desperately needs to scale. It is “full”, Vitalik Buterin claims. The underlying problem here is throughput. The Ethereum network, though being the most popular smart contracting platform with developer support, has a measly 15 TPS when the network is “light”, and clogs at peak times.
Users had a feel of the cost when ETH prices soared to over $1,000 at the height of the ICO mania of late 2017 and CryptoKitties didn’t make it better.
It worsened the situation, and Ethereum has been trying to scale back, develop and assure developers that the network enjoys the pioneer status and it will eventually bounce back amid competition.
Ahead of Istanbul where several network improving EIPs will be implemented and the Testnet of next year’s Phase Zero of the Beacon Chain, analysts now say that Ethereum will at some point exist as two separate chains.
At Transition, Two Separate Chains will Co-exist
At transition, ETH 1 and ETH 2 will co-exist and two different versions of ETH will trade at exchanges. As development speed up and the network shift to ETH 2, the original ETH will drop to zero as the dominant chain’s ETH soar in value.
Though time and speed of development will determine how long the transition period will last, it is will be quite interesting to see what will pan out and whether ETH prices will dip as a result.
ETH/USD Price Analysis
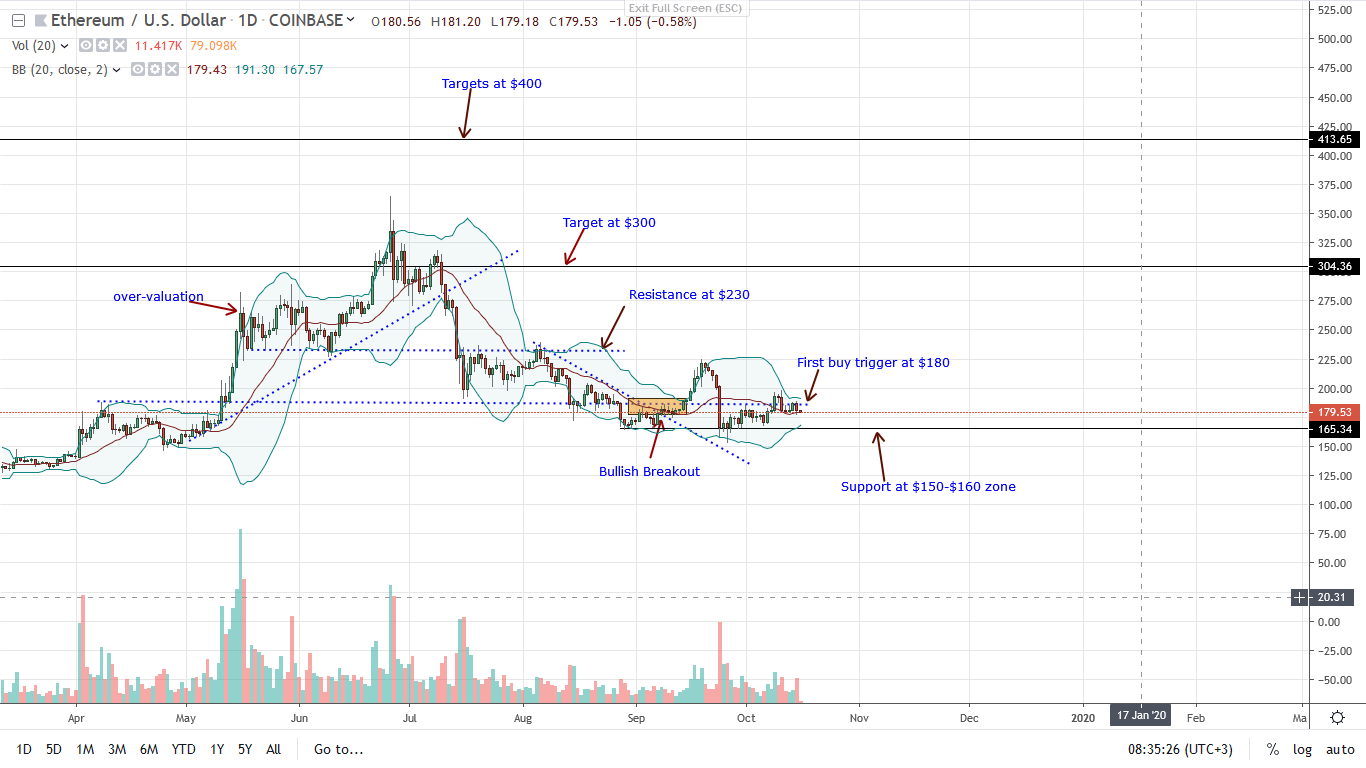
ETH is in range mode. Trading inside Oct 11 trade range, ETH bulls are technically in charge from an effort versus result point of view. Mentioned in previous ETH/USD price analysis, the best course of action is to buy the dips as long as prices trend above $160 with a modest target at $230.
Notice that ETH prices are stagnating above the middle BB. Therefore, as long as prices are trending inside Oct 11 high-low, buyers have the upper end. To that end, both set of buyers-aggressive and conservative traders, have a chance in the current set up.
Ideally, it would be perfect for buyers if there is a complete reversal of Sep 24 bear candlestick. That means, any sharp rally above $200 at the back of high trading volumes could see ETH surge to $230.
On the flip side, any drop below $150-160 support zone could see ETH drop to $130, $100 and later $70 as spelled out in previous ETH/USD price analysis.
Chart courtesy of TradingView – Coinbase
Disclaimer: Views and opinions expressed are those of the author and is not investment advice. Trading of any form involves risk. Do your research.