
Ethereum prices are firm when writing, comparatively solid at press time, perhaps buoyed by optimistic buyers.
Despite the confidence that Ethereum’s fundamentals would propel the coin to new highs in the months and years ahead, the broader macroeconomic factors currently determine the immediate to medium-term price trajectory.
As per the arrangement of ETHUSDT candlesticks in the daily chart, it is evident that buyers are still struggling against the wave of sellers. ETH is up a paltry 10 percent from September pits.
Even though there are higher highs relative to the lower BB and the possibility of the coin bouncing from critical support levels marked by the Fibonacci retracement lines, ETH is still trending at the ledge; anytime, the trend could shift against bulls’ favor.
Ethereum’s On-Chain Activity Depressed
The merge is expected to be a game-changer in the long term.
However, Ethereum traders are presently training their eyes on the public chain and waiting for NFT, DeFi, or metaverse activity to resume. DeFi Total Value Locked (TVL) in Ethereum has fallen by more than 60 percent after peaking at over $140 billion in Q4 2021.
Meanwhile, NFTs trading volumes has, like DeFi, been decimated, dropping by a whopping 95 percent over the past few months.
As on-chain activity is depressed. Traders remain apprehensive about aligning their positions with emerging fundamental factors. Therefore, pressure remains on ETH. ETH demand must remain at a fundamental level. This is necessary if the coin is to bottom-up from spot rates.
Ethereum Price Analysis
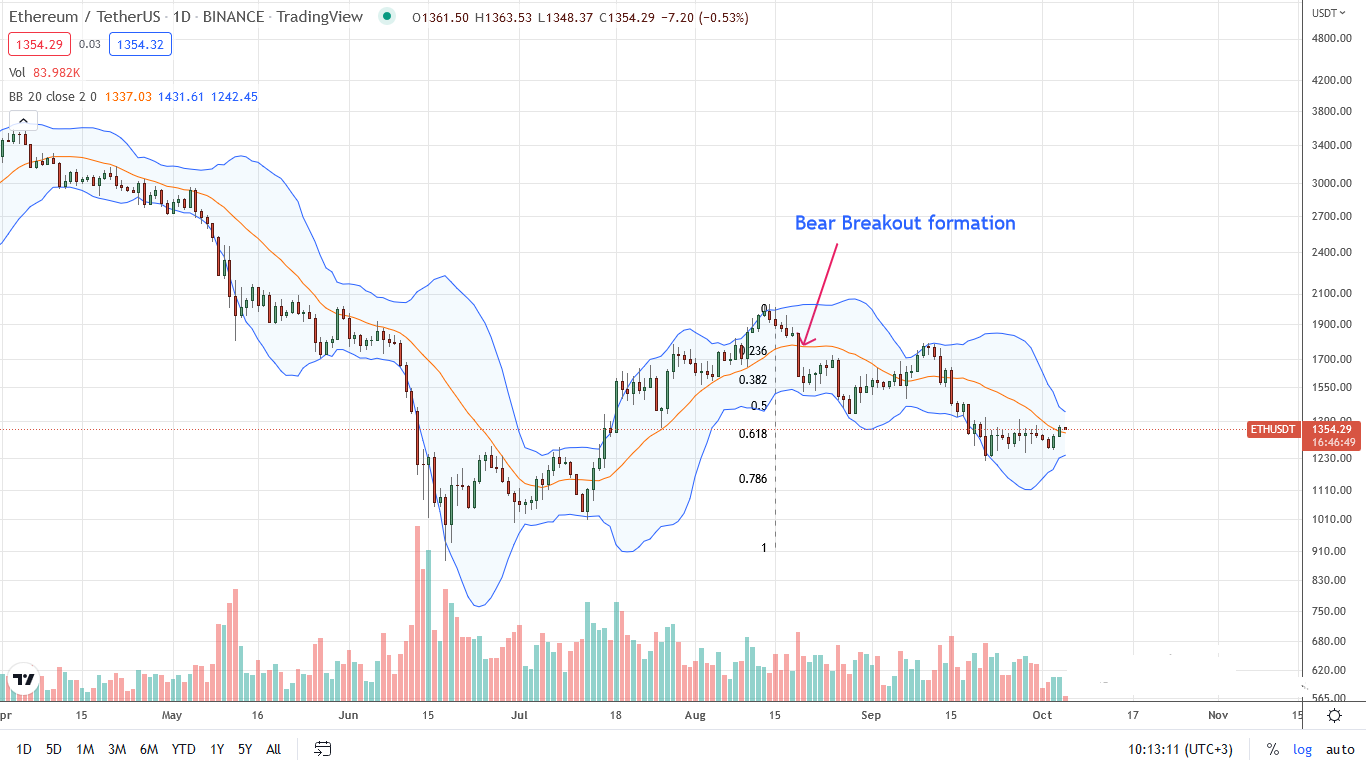
Currently, ETH is up 10 percent from September lows but steady, even firm, in the past 48 hours.
From the daily chart, traders may search for loading opportunities if only prices are sustained above $1.25k. For this preview to hold and traders must find strength. As such, there must be a follow-through of October 3 gains, lifting prices above last week’s highs at around $1.4k. The surge should be preferably with expanding trading volumes.
If buyers take control and rally, a W-Formation pattern will likely print. The base will be from the past two-week support line at $1.25k. Subsequently, aggressive traders may accumulate, targeting $1.5k and later $1.8k.
On the reverse side, sharp losses below $1.25k, reversing gains from October 3, would pour cold water on the uptrend. In that case, ETH may likely slump to $1.15k in a bear trend continuation formation. The $1.15k level coincides with the 78.6 percent Fibonacci retracement line of the June to August 2022 trade range
Technical charts courtesy of Trading View
Disclaimer: Opinions expressed are not investment advice. Do your research.
If you found this article interesting, here you can find more Ethereum News.