Even after the successful transition, Ethereum remains under immense selling pressure.
For context, the coin is down 17 percent week-to-date and below $1.5k.
Since the dominant trend is clear, traders can search for entries to ride the wave down, targeting $1k.
This is especially the case if ETH bulls fail to flow back and pump the coin back to $1.5k and even $1.6k in the medium term.
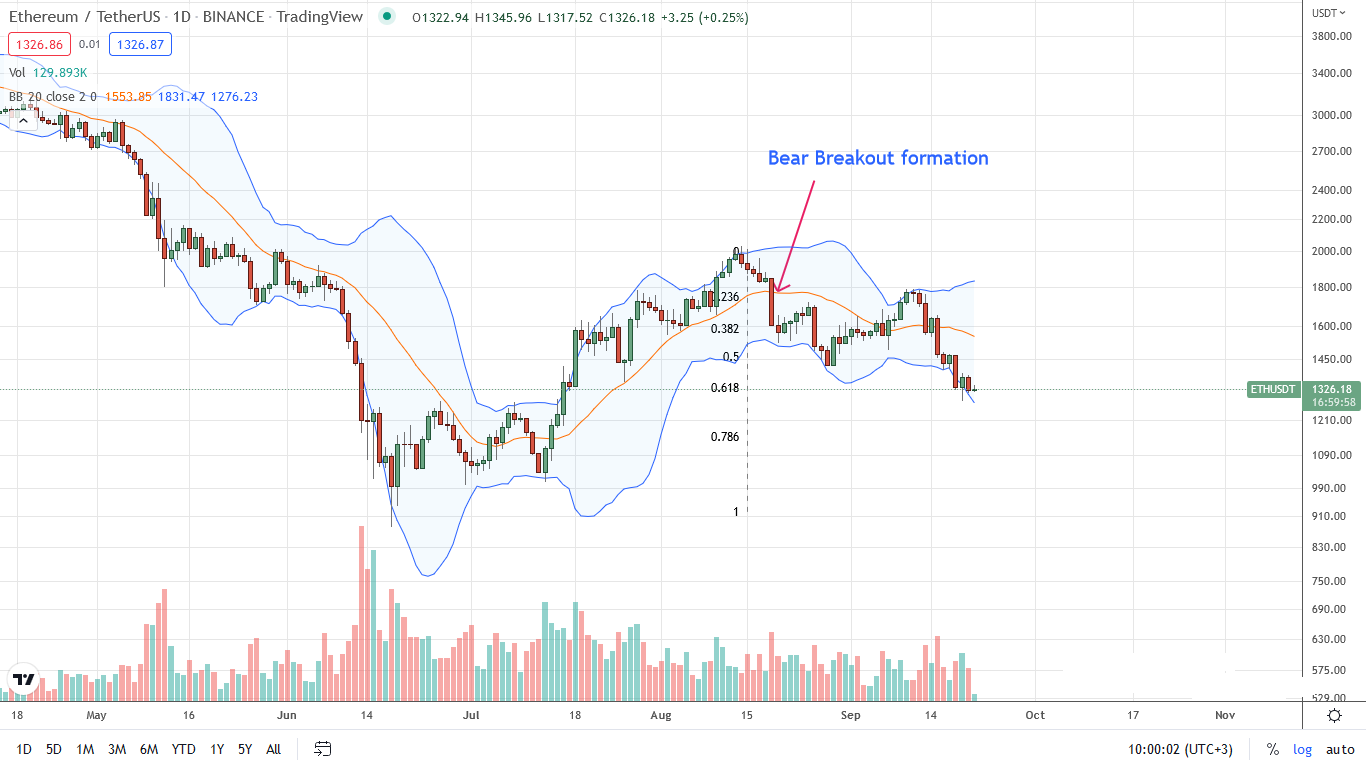
Per the ETHUSDT candlestick arrangement in the daily chart, sellers are dominant. Specifically, the trend is shaped by the bear bar of September 18—a bear breakout candlestick.
The Merge Effects
Ethereum is now a proof of stake network following a successful Merge. Even though there were some breakaway networks, Ethereum is the dominant chain. It continues to be the second most valuable network.
Post-Merge, Ethereum is secured by validators who have to stake ETH for a chance to validate transactions and decentralize the network. There are concerns that Ethereum may not be secure and decentralized like it was before.
However, supporters are adamant that Ethereum is secure, robust, and cleaner, making it sustainable in the years to come.
Ethereum miners have been forced to deploy their hash rate to compatible Ethash networks after the migration. However, since Ethereum was the most profitable to mine, Ethermine, the once largest mining pool in Ethereum, has shut down its servers.
Ethereum Price Analysis
ETH is bearish at spot rates and could track even lower in the days ahead. The coin is down 17 percent in the past seven trading days but stable on the last trading day.
A notable observation is that ETHUSDT prices are inside the bearish engulfing bar of September 18. Technically, from volume analysis, sellers are in charge. It is despite the revival of September 19 when prices edged higher, rejecting sellers of the previous days.
Per the candlestick arrangement in the daily chart, ETH traders can unload the coin on every attempt towards $1.46k with targets at $1.1k, the 78.6 percent Fibonacci retracement level of the June to August 2022 trade range. If prices recover above $1.5k and this week’s high with expanding volumes, the coin may race back to retest August 2022 highs at around $1.8k.
Technical charts courtesy of Trading View
Disclaimer: Opinions expressed are not investment advice. Do your research.
If you found this article interesting, here you can find more Ethereum News.