The Ethereum price is back above the $3k level, following sharp declines on April 11. Although ETH is steady versus USDT and BTC, the coin is still down nine percent in the previous trading week. While the steadies, there is general apprehension amongst traders despite positive developments in the pipeline in the coming few weeks.
The Ethereum Proof-of-Stake Shadow Fork is Live
Thus far, the shadow fork of the Ethereum proof-of-stake ledger went live on April 11. Developers activated the shadow fork to stress test the system and verify whether assumptions work on existing test networks and the mainnet. The outcome will determine when the merger will happen.
The significance of the Merge and Proof-of-Stake
The eventual merger of the Beacon Chain activated in Phase 0 and the current proof-of-work blockchain is highly anticipated. It will be a historic moment for Ethereum developers. There are major changes that will be tagged along with this migration.
The primary one is shifting from an energy-intensive network to an energy-efficient blockchain layer with similar capabilities as the previous ledger. For what’s there, the migration to a staking network is a win for environmentalists and a reason, possibly, for government agencies fighting climate change to deploy on Ethereum—a net positive.
Additionally, following the merger, it is expected that ETH in circulation will be reduced as no new ETH will enter circulation until there is a complete transition to a staking network.
Ethereum Price Analysis
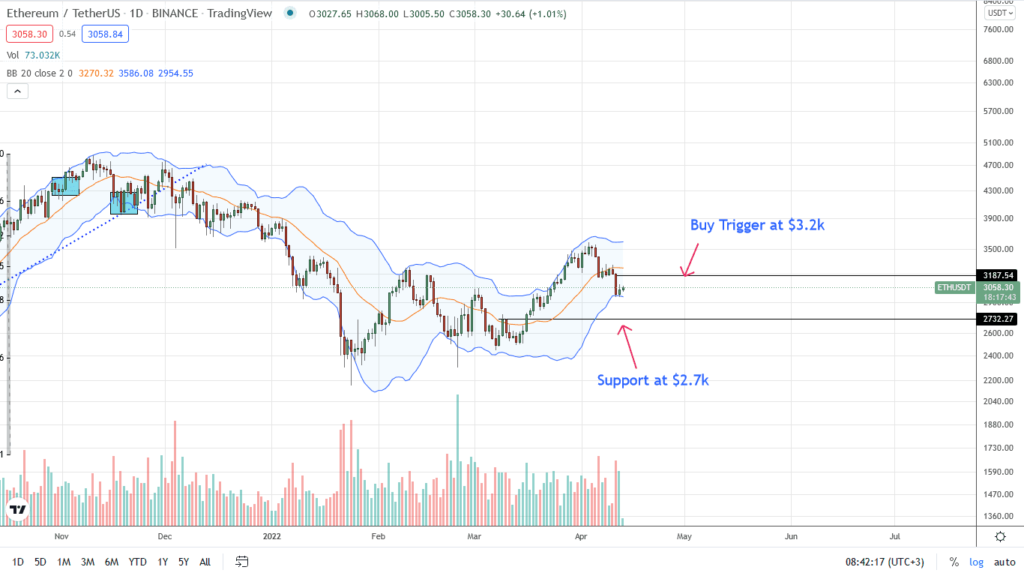
Even though there are hints of strength as per the formation in the daily chart, ETH is technically within a bear breakout formation. The coin is down nine percent in the previous week of trading and below the middle BB.
While the recovery is encouraging and welcomed, the failure of bulls to unwind the steep losses of April 11 means sellers are still in control from an Effort versus Results perspective. Based on this, aggressive traders may unload on every pullback within the wide-ranging, bear engulfing bar of April 11.
Furthermore, as long as prices are trending below the middle BB and $3.2k, every high is a selling opportunity for risk-off traders targeting $2.7k in the short term. The $2.7k mark flashes with the 78.6 percent Fibonacci retracement level of the March 8 to April 3, 2022 trade range.
Technical charts courtesy of Trading View
Disclaimer: Opinions expressed are not investment advice. Do your research.
If you found this article interesting, here you can find more Ethereum News