
The cryptocurrency market remained tepid, so did altcoins such as Ethereum [ETH], Cardano [ADA], and Polkadot [DOT] as volatility in the market narrowed. The rising sell-offs disrupted the hints of the northbound price surge at the beginning of the week.
The global crypto market slipped to $1.36 trillion while volume also noted a double-digit decline. Typically, the altcoin cohort moves higher than Bitcoin [BTC], however, this has not been the case this time around and as the king coin projected recovery signs, the other tokens continued to flash red.
Ethereum [ETH] Daily Price Chart:
Ethereum [ETH] formed higher lows as bears grappled the market. Over the past 24-hours, the altcoin was down by 3.28% which pushed its price to $2,083 while holding a market cap of $243 billion.
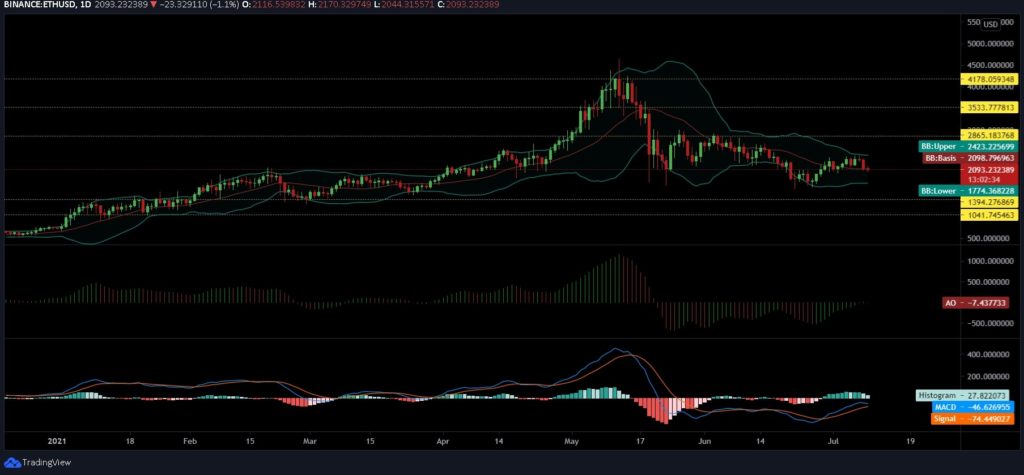
The convergence of the Bollinger Bands suggested that the price action of ETH could turn less volatile in the coming days and the asset could potentially oscillate within a tight rangebound. The tiny red bar of Awesome Oscillator depicted a shift towards the bearish momentum in the ETH market. The buying demand was interrupted as sellers resumed in the market as shown by MACD which appeared to be heading for a bearish crossover in the coming days.
Hence, the bears are likely to mount a stiff resistance for Ethereum at $2,865, which has rejected several upward attempts by the digital asset. The other target points stood firm at $3,533, and $4,178 respectively. If it breaks below the current area, ETH could find itself revisit support levels of $1,394, and $1,041.
Cardano [ADA] Daily Price Chart:
Cardano [ADA] has outperformed its peers of late but due to the latest drawdown, the crypto-asset turned down from a key resistance level after the asset lost 3.26% in the last day. This pushed its price to $1.32. At the time of writing, ADA’s market cap stood at $42.32 billion.
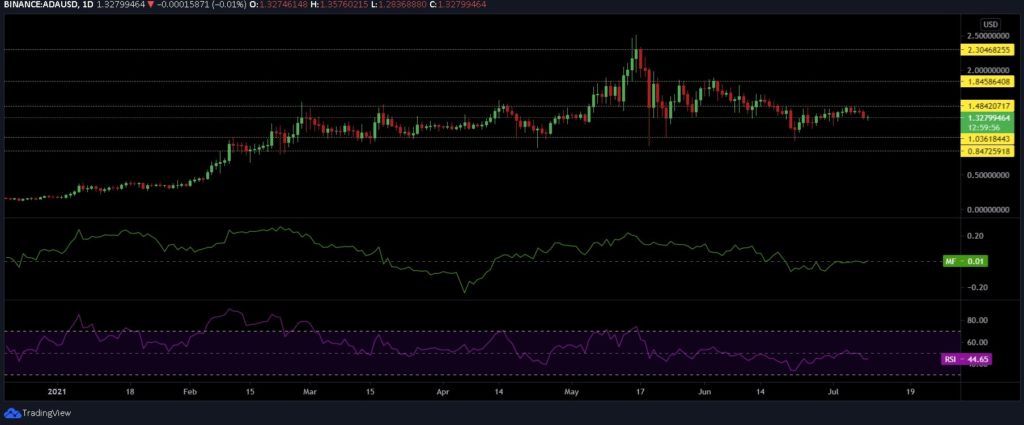
Since taking a major hit that resulted in losing grip from the bullish territory, the Chaikin Money Flow [CMF] was still hovering on top of the median line for the past two weeks. This suggested a neutral trend as capital inflow and outflow nullified a definitive market direction. The Relative Strength Index [RSI], however, turned down from the 50-median line and moved towards the oversold conditions as selling intensified in the coin market. ADA’s low volume was another major cause of concern.
Cardano escaped from retesting the immediate support level of $1.03 during the last major pullback. However, if the bulls fail to defend the current level, ADA could potentially risk damaging fall, which if breached could bring another support level of $0.84 at play.
Polkadot [DOT] Daily Price Chart:
Polkadot [DOT] was currently priced at $15.13 and was still down by 2.39% over the past 24-hours. It registered a market cap of $14.67 billion. DOT’s sell-off has been extensive as it dropped to pre-Feb levels but signs of an uptrend sprung up.
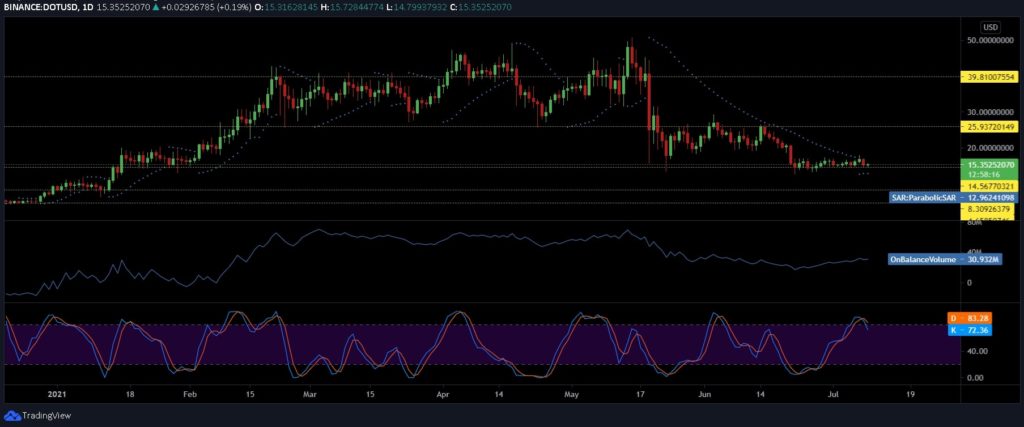
Following a minor recovery after yesterday’s correction, the dotted markers of the Parabolic SAR aligned below the DOT price candles depicting the formation of a crucial support at the current region. The OBV indicator, however, observed a lack of volume, which could be attributed to the price being stuck near the 2021-lows. The Stochastic RSI bounded from the overbought territory and sustained a bearish crossover but was still in the bullish zone. This could indicate that a profit-taking phase is likely over and buyers could emerge thus pushing the price higher.
If Polkadot gains the necessary momentum, the asset could reclaim its resistance levels of $25.93, and $39.8. On the flip side, the support levels were found at $14.56, and $8.30
If you found this article interesting, here you can find more Blockchain and cryptocurrency news