TL;DR
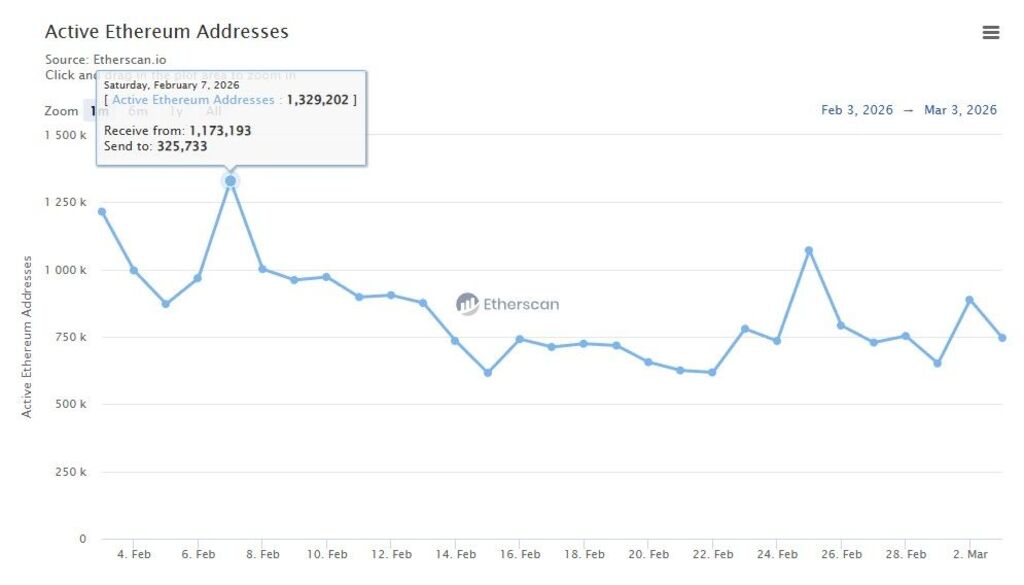
- Ethereum daily active addresses dropped 45% from 1.33 million to 746,062.
- Price jumped 6.62% to $2,078 despite the sharp on-chain activity decline.
- Open interest rose 8.8% as traders added leveraged long positions.
Ethereum shed nearly half its daily active addresses in less than four weeks. On February 7, the network recorded 1,329,193 active addresses in a single day. By March 3, that figure had fallen to 746,062 — a 45% drop that signals a sharp pullback in on-chain participation, according to data retrieved from Etherscan.
The February peak sat uncomfortably close to Ethereum’s all-time record of 1,420,187 active addresses, a number the network hit on December 9, 2022. The proximity of one to the other made the subsequent collapse all the more visible. When a network approaches its historical ceiling and then gives back nearly half its activity within weeks, the gap between perception and reality becomes hard to ignore.
Ethereum’s price spent most of the first quarter of 2026 under sustained selling pressure, and lower prices historically compress on-chain activity. Fewer people transact when confidence weakens.
Fewer developers deploy contracts when capital sits on the sideline. The address count reflects all of it simultaneously, making it one of the cleaner indicators of genuine network demand rather than speculative noise.
What the data raises, in practical terms, is a question about whether the drop in activity represents a temporary reaction to price conditions or a deeper loss of user engagement with the network itself.
A Ethereum 6% Price Jump and Rising Trader Confidence Complicate the Bearish Picture
March 3 ended with a counterpoint to the address data. Ethereum climbed 6.62% within 24 hours to trade at $2,078, recovering ground at the same time Bitcoin crossed back above the $70,000 mark. Capital rotated into large-cap digital assets across the board, pushing total cryptocurrency market capitalization up 4.8% to $2.42 trillion.
Perpetual futures open interest rose 8.8% over the same period, and funding rates jumped 21%. Both readings point to traders adding leveraged long positions with growing conviction — not a cautious dip-buy, but an aggressive repositioning toward upside exposure.
Ethereum faces resistance near $2,150, a zone where sellers contained prior recovery attempts. A clean break above that level opens a path toward $2,300 as the next logical area of interest. On the downside, a drop below $2,000 would expose the $1,900 region and put the entire recovery structure at risk.
Ethereum Holds Key Support at $2,000 as Technical Indicators Flash Mixed Signals
The price of Ethereum (ETH) stands at $2,150.35, recording a marginal change of 0.09% from the previous close. The cryptocurrency posted an intraday high of $2,153.65 and a low of $1,947.76, reflecting the current market volatility.
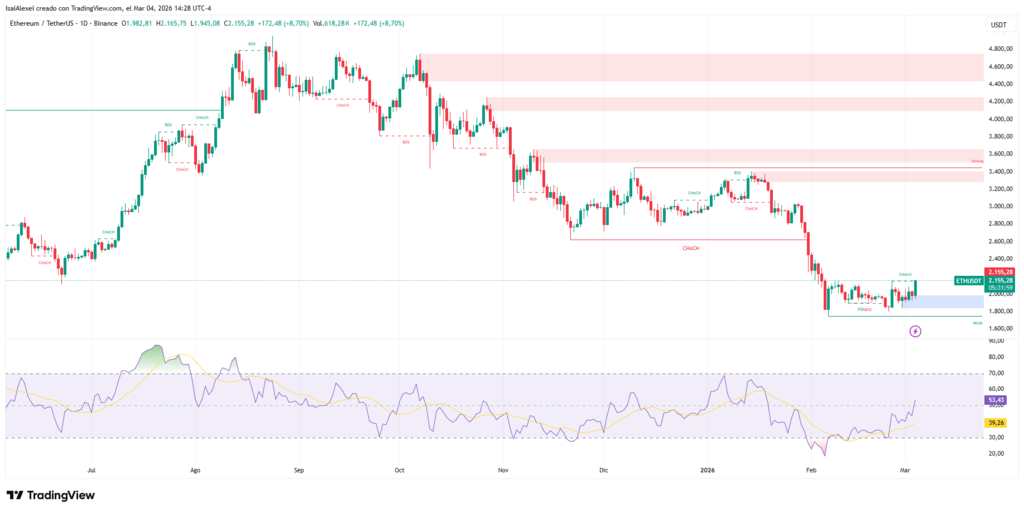
Traders now focus their attention on the zone between $2,000 and $2,200, a range that has historically acted as support during previous corrections. The asset’s ability to remain above this level is crucial to preventing an extension of losses.
Recent technical analysis warns of a potential bearish breakdown. If ETH fails to hold the current support, the next target would sit near the $1,725 mark. This projection comes from studying price bands and on-chain metrics that identify past accumulation zones.
The structure on the daily chart shows the price trading below the 20, 50, and 200-day moving averages, a configuration that reinforces the underlying bearish trend.