Cardano [ADA] has had a 22.9% depreciation in value over the past seven days from around 0.04265 USDT on the 29th of November to 0.03289 USDT today on the 6th of December 2018.

The cryptocurrency achieved the weeks high on the 29th at around 10: am by reaching 0.04487 USDT before setting out on a marked bearish motion to the weeks low today at around 2pm by hitting 0.03287.
Upon reaching the weeks low earlier today, the price rebounded upwards to the current price. As expected, the past 24 hours have seen the price declining by -6.45% as the 24 hour volume declined to about 7.1 million USDT. The 24 hour high and low are set at 0.03590 USDT and 0.03200 respectively USDT.
A LOOK AT THE INDICATORS
BOLLINGER BANDS.
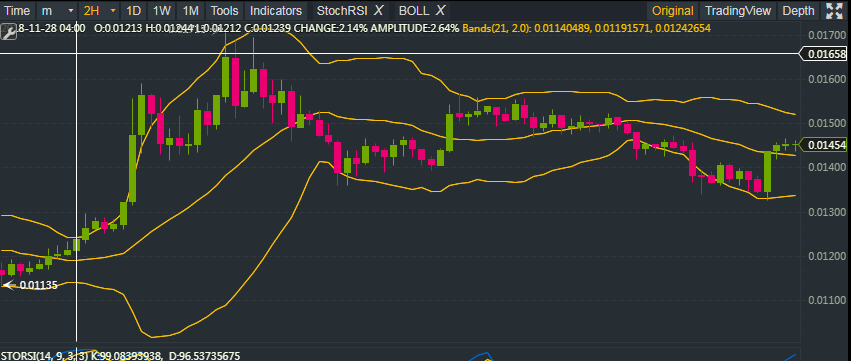
From the 29th of November to the 1st of December, the Bollinger bands exhibited marked divergence as the price reached the week’s high before beginning its swift descent thus marking a period of the highest volatility in the week.
This period was followed by a period of low volatility which was also demonstrated by the convergence of the Bollinger Bands between the 1st and 4th December. From the fourth to date, the price continued plummeting in a strong downward trend with slightly increased volatility as demonstrated by the mild divergence of the bands.
The trend line has been strongly biased towards the lower band since the beginning of the downtrend and is now exhibiting a change of direction towards the midline, thus signaling the possible beginning of a short term bullish trend reversal.
RELATIVE STRENGTH INDEX (RSI)

The RSI trend line is consistent with the general price trend as it has demonstrated a strong bearish movement starting above 50.0000 on the 29th taking us to the current overbought condition at 30.0000. The RSI trend line has been lingering just above and below the lower limit (30.0000) since yesterday (05/12/2018).
This suggests a good entry point for traders provided that the price responds to the current conditions as demonstrated by the indicator.
This observation also concurs with what the Bollinger Bands are suggesting by pointing towards an imminent trend reversal shown by the mild divergence and trend line rebounding off the lower band.
MOVING AVERAGE CONVERGENCE DIVERGENCE (MACD)
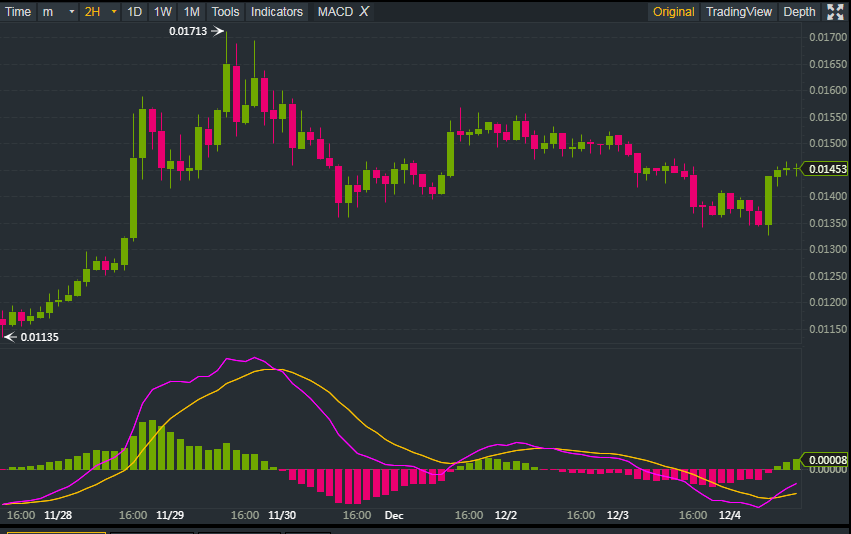
Currently, the moving averages are exhibiting divergence along with an evenly sized histogram since the beginning of the strong downtrend.
Notable events prior to the steep descent are three moving average crossovers and convergence consistent with the series of high’s and lows, which are more of micro trends within the general bearish price movement.
The lack of a notable change of direction of the faster moving average (pink) suggests a possible continuation of the downtrend at least in the next few hours.
StochRSI
The StochRSI is agreeing with the RSI as both trend lines have been in the overbought zone and the vicinity of the lower limit (20.0000) since yesterday.
Previous major events include two oversold conditions and one overbought condition, all reflecting the peaks and lows achieved by the price over the past 7 days.
Like the Bollinger’s, the RSI, and MACD, the StochRSI shows a typical bearish trend line which may currently go through a short term upward fluctuation which is part of the continuing bearish direction.
Conclusion
In a nutshell, Cardano [ADA] has been struggling for the past six days as it plummeted from the week’s high to the current price tag. However, it is important to note that most oscillatory indicators are pointing towards an imminent trend reversal, as the trend lines have been lingering within strong oversold conditions since the 4th of December.