
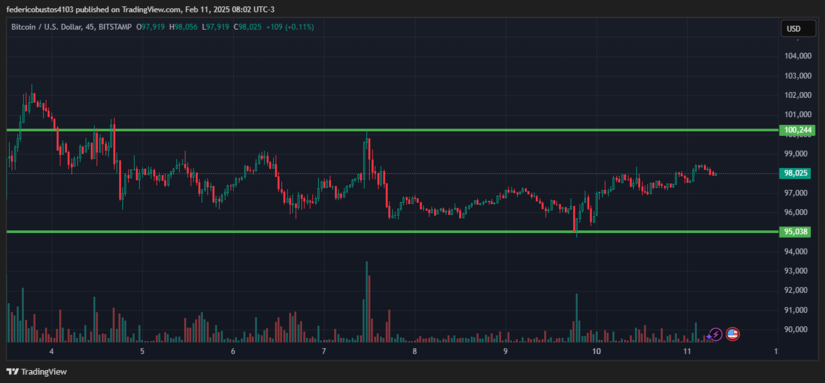
- Bitcoin remains in a sideways range, with resistance at $100,000 and support at $95,000, indicating consolidation.
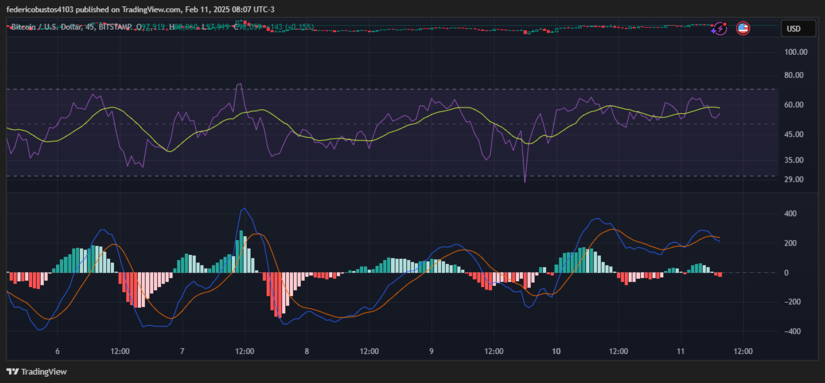
- The RSI stays in neutral territory, showing no clear overbought or oversold signals, suggesting market indecision.
- The MACD reflects a lack of a defined trend, with a line crossover near the zero level, signaling potential consolidation or a lack of momentum.
Fundamental Factors and Their Impact on Bitcoin
Over the past two weeks, several economic and political events have influenced Bitcoin’s price behavior. Currently, Bitcoin is trading around $98,025, with an intraday high of $98,490 and a low of $97,524.
On February 9, Bitcoin briefly surpassed $97,000 ahead of the release of the U.S. Consumer Price Index (CPI) data and Federal Reserve Chairman Jerome Powell’s testimony. These macroeconomic events created expectations of potential interest rate cuts, which could impact financial markets and, consequently, Bitcoin’s price.
On February 10, Bitcoin maintained its position around $97,000 despite trade tensions and stock market volatility. Bitcoin’s resilience in this context suggests that investors view it as a safe haven amid economic uncertainty.
Bitcoin Technical Analysis
Bitcoin is moving within a sideways range between $95,000 and $100,000 on the M45 timeframe, with multiple rejections at support and resistance levels. Low volatility and moderate volume indicate market indecision. A key breakout is expected to determine the next trend, with liquidity accumulating at critical levels.
The RSI (14) remains around 54, indicating a lack of strong momentum in either direction. There are no clear signs of overbought conditions (>70) or oversold conditions (<30), suggesting that the market is in temporary equilibrium.
The MACD (12,26) also reflects uncertainty. The MACD and signal lines crossed multiple times during the trading session on February 10, indicating a lack of a dominant trend. To confirm a potential bullish direction, a clear separation of these lines with increasing volume is needed, something that has not yet been observed.
Given this price action indecision, BTC remains trapped in a channel with strong support at $95,000 and resistance around $100,000.
To confirm a bullish trend, Bitcoin must decisively break above $100,000, accompanied by a rise in volume, which could open the door to a next target around $106,000. Conversely, if support at $95,000 is lost, BTC could quickly drop to $92,000 in the short term.
Technical charts courtesy of TradingView.
Disclaimer: The opinions expressed do not constitute investment advice.If you are looking to make a purchase or investment, we recommend that you always do your research.
If you found this article interesting, here you can find more Bitcoin News.