
TL;DR
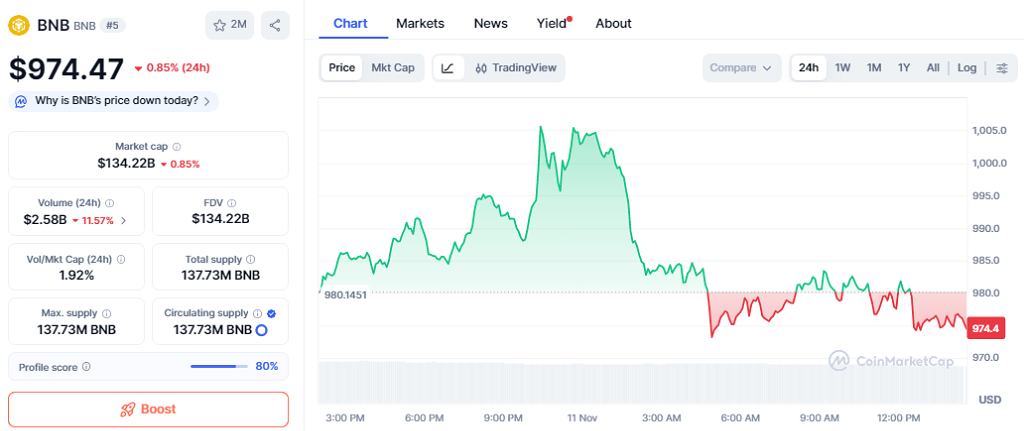
- BNB shows a neutral short-term bias with minor bearish undertones, trading at $974.47 after a 0.85% drop in the last 24 hours.
- Technical indicators highlight key support at $966.8 and resistance near $1003, while the daily EMA structure suggests mixed momentum.
- Market sentiment remains cautious with BTC dominance at 57.7% and the Fear & Greed Index reading 26, signaling fear and limited liquidity rotation.
BNB maintains stability despite recent minor declines, trading at $974.47 with a 0.85% decrease over 24 hours. The market shows a neutral bias, highlighting key pivot levels that traders are closely monitoring for potential short-term trends.
Technical Analysis of BNB Reveals Mixed Momentum
BNB price remains below the EMA20 ($1032.31) and EMA50 ($1043.89) on the daily chart, while EMA200 ($884.6) sits below, creating a compression zone that signals neutral momentum. Daily RSI sits at 40.41, indicating mild bearish sentiment, and MACD shows negative continuation. Bollinger Bands range from $912.6 to $1185.33, offering ample room for intraday moves. Immediate support lies at $966.8, with secondary cushioning near the lower Bollinger band at $912.6. On the upside, the pivot at $987.7 and resistance at $1003 provide key barriers before reaching the Bollinger mid at $1048.96.
Intraday Pivot Zones Provide Trading Opportunities
On shorter timeframes, H1 price closes at $982.25 with slightly negative momentum, showing short-term selling pressure without strong bearish conviction. M15 oscillators suggest potential quick mean-reversion bounces, allowing scalpers and intraday traders to exploit minor price swings. Range-bound activity between $966.8 and $1003 is likely unless a breakout occurs. Daily structure and ATR indicate elevated volatility, emphasizing careful risk management with stops for defensive positions.
Market Context and On-Chain Activity
Total crypto market cap stands at $3.64 trillion, with BTC dominance at 57.7%. Fear & Greed Index is 26, reflecting caution. PancakeSwap and DeFi activity continue to generate throughput, although broader on-chain flows remain limited. Traders are selectively engaging in BNB while monitoring for signs of breakout or breakdown beyond key pivot levels.
BNB remains range-bound with a neutral-to-bearish tilt, favoring defensive trading and selective longs. Key levels at $966.8 support and $1003 resistance define near-term risk, and traders should watch for a daily close above or below these pivots to confirm the next directional move. Until then, BNB price is expected to fluctuate within current ranges, offering measured trading opportunities.